Monday, August 31, 2020

Cumulative COVID-19 Cases by Municipal Area in South of Fraser/Fraser Valley

The BC CDC has recently shared the number of COVID-19 cases by Local Health Area. They included a map which has a colour-coded representation of the cases per 100,000. To help quantify the data further, I thought I would create a chart.

This chart is based on the following table which includes the cumulative number of COVID-19 cases from January until the end of July from the BC CDC, and the 2019 municipal population estimates.

Municipal Area Population Cumulative Cases Rate per 100,000
Chilliwack 94,534 34 36
Delta 109,490 62 57
Ridge Meadows 110,950 96 87
Langley 158,642 138 87
Surrey/White Rock 605,553 585 97
Abbotsford 158,457 454 287
Mission 43,202 158 366

As a note, there was a serious COVID-19 outbreak in the Mission Institution medium security federal prison.

Thursday, August 27, 2020

Aerial photo shows western portion of Downtown Langley City in 1985

I am interested in the history of Langley Prairie, now Langley City. It is important to know about the anthropology for where we live, including how we move around. Langley City exists today because it was a path between what we now called the Salmon River and Nicomekl River. Later, it became an important commercial hub as it was at the intersection of Yale Road to the interior, and Glover Road to Fort Langley. Yale Road became the first alignment of the Trans-Canada Highway.

You can learn a lot about a community by observing its transportation networks. Last year, I wrote a post called, “The search for the meaning of “crescent” found in aerial photos of mid-20th century Langley City.” The post contains old aerial photos of Langley Prairie from that time period.

Downtown Langley City in 1985, focused around 203rd Street. Select image to enlarge.

Recently, I received a Facebook message directing me to Waite Air Photos which has aerial photos of Langley dating back to 1985. These pictures must be purchased for use.

One of the pictures that stood out to me shows the western end of Downtown Langley in 1985.

It is interesting to see the significant changes to the road network over the years.

For example, 203rd Street did not connect between 56th Avenue and Fraser Highway. It was the site of a Safeway. Today, I wonder if extending 203rd Street was a good idea; the extension has made a challenging intersection.

You can also see how 56th Avenue between 7-11 and the former Langley Hotel was a major route. The bottom of the photo (where there is a parking lot) was the old Interurban rail alignment which provided passenger and freight service from Vancouver to Chilliwack until the mid-20th century.

201A Street was also a major route. You can see some of the early apartments that were built in our community. 201A Street made a 90 degree turn at what is now Linwood Park, to connect to 200th Street back then.

If you look at the top of the photo, there is no Willowbrook Mall, and the Langley Bypass actually bypassed Langley City.

There are many other observations that can be made by looking at Langley City 35 years ago.

Wednesday, August 26, 2020

Reducing on-site parking to fight climate change and create a more affordable Langley City

Langley City staff, consultants, and council are in the process of updating our Official Community Plan. This foundational plan will help guide development in our community, if adopted, for years to come. There has been significant consultation to date about the proposed updated OCP. Earlier this summer, I posted about the key themes that emerged from the visioning workshops, open houses, pop-up events, and online survey.

Creating more affordable housing options and fighting climate change were two of the five key themes. The new OCP is being planned for a community with high-quality transit in mind such as RapidBus and SkyTrain. One of the ways to create affordable housing options and fight climate change is to reduce on-site parking requirements.

I posted in 2019 that a recent Metro Vancouver Regional District study found that there is an oversupply of on-site residential apartment parking in our region, including in Langley City. The cost to create a apartment parking spot is around $55,000 each.

When it comes to commercial property, surface parking lots create impervious surfaces which have a negative impact on environmental and human health. For example, unfiltered stormwater which contains pollutants ends up in our ecosystem when it rains. Impervious surfaces such as surface parking lots also contribute to the heat island effect.

Surface parking lots also cause buildings to be spread out which reduces walkability.

One of the interesting case studies in Langley City is Valley Centre Mall. This mall is located at 201A Street and Fraser Highway. It has seen two infill projects over the years: the Starbucks and Scotiabank buildings which front Fraser Highway. Because of these infill projects, the property owner is required to maintain a parking lots off Industrial Avenue to meet the current City’s minimum on-site parking requirements.

The following picture shows what that parking lots normally looks like.

Parking lot for Valley Centre Mall at 20229 Industrial Avenue. Select image to enlarge.

While Valley Centre Mall has a busy main parking lot, there is normally parking available.

Langley Mall is located near City Hall. Its parking lot was only ever full when the Cruise-In event happened in our community.

Recently, Langley City council has supported staff recommendations to reduced on-site parking requirements for projects near future SkyTrain stations.

While parking is tight in some single-family and townhouse-only areas, there is opportunity to reduce on-site parking requirements for apartment and commercial areas.

This will help create a more affordable and walkable community, and will help fight climate change.

Tuesday, August 25, 2020

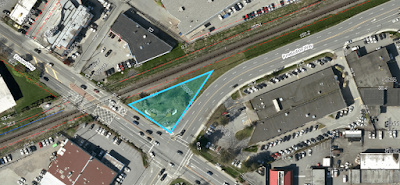
Unofficially naming the parklet at the corner of Production Way and Fraser Highway. People’s suggestions revealed.

Over the last few weeks, I asked people to submit their naming suggestions for the unnamed parklet at the corner of Fraser Highway and Production Way. This survey was not official in any way.

Location of unnamed parklet - 5999 Production Way. Select image to enlarge.

With so many serious things going on right now, sometimes it is good to have a little break. There were 47 suggestions received. There were of course some silly suggestions such as Parky McParkface and Pachal Park.

After some curation of the names received, here is the list of suggestions with context as required:

  • By the Rails Park
  • FP Park - Fraser Production.
  • Fraser Way Park
  • Heroes Park
  • Hunter Vogel Park - First Mayor of Langley City. Appointed between March 15, 1955 and May 29, 1955.
  • Industrial Park
  • Jack Arnold Park - Long serving Langley City Councillor from 1990 until 2018.
  • Joe Chesney Park - Started BC's first full-time country music radio station, broadcasting from Langley from the early 1960s to mid 1980s.
  • Lucky Triangle Park
  • Pleasant Park
  • Production Park
  • Railway Park
  • SkyTrain View Park
  • tawâw Park – Cree word meaning “come in, you're welcome; there's room.”
  • Triangle Park
  • Willowbrook Park

In the next little bit, I’ll put together a survey for people to vote for the unofficial name of the park based on these suggestions.

Monday, August 24, 2020

What Ends up on a Street Makes Its Way into a Creek: Stormwater, Brydon Lagoon, and the Nicomekl River System

Recently, I’ve been reviewing some of the older reports that Langley City has commissioned. One of the reports is titled “Pond Management Strategies” which focuses on Brydon Lagoon, the pond by the Seniors Resource Centre, and the former ponds at Sendall Garden.

In 2012, this strategies report was commission because it was recognized that the ecological, recreational, and stormwater management functions of these ponds were significantly deteriorated. The report was completed in the spring of 2013. In the summer of 2014, around 500 to 1,000 fish died in Brydon Lagoon. The combined completion of the strategies report, fish kill, and resulting Brydon Lagoon task force ensured that action is continuing to this day to improve the water quality of the ponds in our community. You can read more detail about this history over a handful of previous posts that I wrote on the topic.

One of the things that most people know is that stormwater goes from our streets directly into ponds, creeks, and rivers. While people generally don’t dump oil, soap, pool water, or chemicals down storm sewer drains anymore, other waste can still make its way into our natural systems including residue from leaky vehicles, and garbage including cigarette butts.

The following two maps from the Pond Management Strategies report show how stormwater drains connect to local ponds and waterways.

Brydon Lagoon is a significant feature of our community. If you live in the Brydon area, most of the stormwater including residue and garbage can find its way into Brydon Lagoon or the Nicomekl River.

Storm sewer around Brydon Lagoon. Select image to enlarge.

The next map shows the area around the Seniors Resource Centre.

Storm sewer around Langley Seniors Resource Centre. Select image to enlarge.

Today, Langley City requires that new development projects include “Stormceptor” type systems which help reduce residue and garbage from entering our ponds and waterways. Many parts of our community do not have “Stormceptor” systems, and even were they do exist, they capture most but not all contaminants.

Reviewing this report reminded me of the importance of ensuring that only rainwater makes its way into stormwater drains in our community. Next time you see garbage or a rainbow-shine along the Nicomekl River system, remember that it could have come from any part of our community.

Thursday, August 20, 2020

Why does it seem that August is always a busy month for construction projects in Langley City?

Over the last few weeks, you’ve likely noticed that there are various construction projects occurring in the Nicomekl trail system. You likely also noticed the replacement of the culvert under the Langley Bypass at Logan Creek is underway. While summer is always a busy time for construction, it might seem that August is an especially busy period for City construction projects.

Trail closure sign. Select image to enlarge.

It is not just in your mind, August is a busy period for construction projects in our community.

Nicomekl River Erosion Control Works project sign. Select image to enlarge.

It is a busy period for construction because we have a significant number of rivers, creeks, streams, and drainage ditches in Langley City. Because these watercourses contain fish, any construction project that directly impacts watercourses must follow provincial regulations which help to minimize risk to fish and other aquatic organisms.

The lowest risk to fish is around August as shown in the following chart from the provincial government.

Highest (dark shaded) and Lowest (un-shaded) Risk Periods for Lower Mainland Fish Species. Select table to enlarge.

These tight low-risk windows are also why a small delay in a construction project around a watercourse can cause the project to be delayed for a year. Projects must occur within the low-risk window.

If you’d like to learn more about the importance of watercourses in our community for salmon, please check out the Nicomekl Enhancement Society website.

Wednesday, August 19, 2020

Authorized Police Strength by Municipality in the Lower Mainland

Yesterday, I posted some information about Langley City’s Community Crime Prevention Strategic Plan. In that post, I noted that Langley City has a high RCMP to resident ratio. I thought I would expand on that point.

Using information from Statistics Canada, BC Stats, and the Township of Langley, I created the following chart and table which shows the authorized police officer strength per 100,000 population in the Lower Mainland.

Authorized police officer strength per 100,000 in the Lower Mainland. Select chart to enlarge.
Population Authorized police officer strength Authorized police officer strength per 100,000 population
North Vancouver District 89,435 78 87.2
Kent 6,464 6 92.8
Richmond 209,838 223 106.3
Coquitlam 149,450 162 108.4
White Rock 20,873 23 110.2
Maple Ridge 90,630 101 111.4
Langley Township 128,999 144 111.6
Burnaby 248,071 277 111.7
Pitt Meadows 19,924 23 115.4
Port Coquitlam 62,626 73 116.6
North Vancouver City 57,021 67 117.5
Mission 41,860 51 121.8
Chilliwack 95,641 124 129.7
Surrey 568,158 773 136.1
Abbotsford 153,866 219 142.3
New Westminster 77,950 112 143.7
Port Moody 35,138 52 148
West Vancouver 46,643 79 169.4
Delta 109,674 190 173.2
Langley City 27,595 51 184.8
Hope 6,357 12 188.8
Vancouver 678,308 1,327 195.6

This information is from 2018 which is the most recent year that information is available from Statistics Canada. Information for Langley was combined in 2018, so I used information from the Township of Langley and BC Stats to break out the numbers.

Authorized police strength means the number of police officer positions allowed to be filled, whether they were filled or vacant.

Tuesday, August 18, 2020

Five Years Later: Community Crime Prevention Strategic Plan

One of the top things that Langley City businesses and residents want addressed is to reduce criminal and negative activity in our community. This is one of the reasons why the Crime Prevention Task Group was formed in 2017, and why we have the second highest RCMP member to resident ratio in Metro Vancouver.

In the fall of 2015, Langley City released the “Community Crime Prevention Strategic Plan.” I previously posted about this plan. One of the objectives of the plan was to “advocate to senior levels of government to provide the necessary programs and resources to address justice, crime prevention and public safety issues.”

As a municipality, there are many things that we can do though we need the province’s support when it comes to addressing mental health, rent geared-to-income, and addiction management. The following were the measurable outcomes from the 2015 plan which required the support of the provincial government.

“Petition the Province and Fraser Health Authority to provide funding for an Assertive Community Treatment (ACT) Team for the Langleys”

“Petition the Province to provide local access to services for people with mental illness, and for those with both addictions and mental illness.”

These two requests resulted in an Intensive Case Management (ICM) team for Langley. This team is currently at capacity. City council has requested multiple times for this team to be expanded.

“Petition the Province to provide funding for a Car 67”

This service provides crisis intervention, risk assessments, and referrals to individuals. It is a partnership between Fraser Health and the RCMP. This service is still not available to Langley residents.

“Petition the Province to amend the Privacy Act to relax requirements for the implementation of CCTV on public spaces.”

CCTV has been installed in some public spaces in Langley City. CCTV can only be installed if other crime prevention techniques have failed.

“Petition the Province to implement the recommendations from the recently completed Prolific Offender Management pilot project to improve approaches to incarceration and sentencing.”

I do not have an update on this.

“Petition the Province to provide effective drug and alcohol addiction treatment and recovery programs.”

As part of the opioid crisis response, there are more services available through Fraser Health. More services are still needed.

“Petition the Province to provide funding for youth life skills training such as conflict resolution, decision making and employment training at local schools.”

I do not have an update on this.

“Request that the Province install ‘No Panhandling’ signs at major intersections in the City such as 200th Street and Langley Bypass and Fraser Highway and Langley Bypass.”

This was completed.

“Petition the Province to reduce the profit margins for methadone dispensaries.”

I do not have an update on this.

“Petition Fraser Health to provide a psychiatric nurse at the Langley Memorial Hospital.”

I do not have an update on this.

“Petition the Province to strengthen inter-agency collaboration and coordination across the wide range of crime prevention and reduction initiatives.”

As a municipality, we have taken this task on ourself. City staff and council meet with people from Fraser Health, the RCMP, non-profits, and provincial ministries.

While the provincial government has provided more services to our community, there are still gaps that need to be filled. Five years later, we still need more resources from the provincial government to address getting people support to manage addiction, improve mental health, and be lifted out of poverty. This is how we reduce the need for people to commit the kinds of negative activity we see in our community.

Thursday, August 13, 2020

What would you name the parklet at 5999 Production Way?

Unnamed parklet at the corner of Fraser Highway and Production Way

Since I’ve lived in Langley City, I’ve always been curious about the parklet at the corner of Fraser Highway and Production Way. How did it come into existence? And most importantly, why is it unnamed?

Location of unnamed parklet - 5999 Production Way. Select image to enlarge.

With so many serious things going on right now, sometimes it is good to have a little fun.

What would you name this parklet? Complete my Totally Unofficial Name-That-Park Survey. I’d like to know.

Complete the survey at: https://forms.gle/xn2B6isk6ErVh6uo9

I will of course share the results.

Wednesday, August 12, 2020

Official City Statement: Curb-side Recycling in Langley City

As I posted about in July, there was a recent change to residential recycling in Langley City. Through the provincial government’s Extended Producer Responsibility program, industrial sectors are responsible for recycling the products that they produce. For packaging and printing material, Recycle BC is the industry-funded organization that is responsible for residential recycling throughout the province. In Langley City, Recycle BC handles all single-family, townhouse, and apartment recycling. Langley City, the municipality, has no role in residential recycling. Neither property tax nor municipal fees are used to pay for recycling services in Langley City.

Single-Family Recycling Bins

Regardless, Langley City council and staff have received a number of complaints about the recent changes to the single-family curb-side recycling program for our community.

Langley City has released the following statement:

In 2014 the Province mandated that a producer-run recycling program be implemented as a means of incentivizing reduced packaging and waste by producers. As of January 2015, Recycle BC began overseeing single-family recycling collection in the City of Langley and the City was no longer involved in the curbside recycling collection program. At that time the City eliminated the recycling component of the utility fee on residential tax notices and the service is now provided at no cost to curbside collection customers.

The new contractor, GFL Environmental, is enforcing collection rules more vigilantly than had been done in the past. Recycle BC has determined that proper sorting is imperative to the success of the recycling program as contamination results in recycling being redirected to the landfill. This will mean that we all need to be more diligent in sorting our recyclables. For more information please visit https://recyclebc.ca/langley/.

If you have any questions or concerns about the curbside collection program, please contact the collection contractor, GFL Environmental, at 778.765.3662 or srrecycle@gflenv.com. If unsatisfied with their response, then contact Recycle BC at 778-588-9504; Toll Free 1-855-875-3596 or info@recyclebc.ca.

We recognize that this transition has presented some frustration to our residents. We all share the common goal of seeing this program succeed as it is an important piece in protecting our environment.

Thank you for your patience and your commitment to recycling during this transition period. For more information about garbage, recycling and organic waste in the City, visit https://langleycity.ca/city-services/engineering-parks-operations/garbage-green-bin-recycling

Tuesday, August 11, 2020

Langley City and Surrey had highest transit usage in the South of Fraser

As I posted about last week, the number of people that used transit set a record in 2019. I also noted that the new 503 Fraser Highway Express which has limited stops between Surrey Central and Langley City, and provides local service to Aldergrove, was the fastest growing route in Metro Vancouver. This information is contained in TransLink’s 2019 Transit Service Performance Review.

TransLink has provided information on transit ridership by municipality, sub-region, transit service type, and route. The following table shows the average weekday boarding by municipality in 2019.

Municipality Average Daily Boardings Population Boardings Per Capita
Surrey 156717 584526 0.27
Delta 11072 109490 0.10
Langley Township 10768 130924 0.08
Langley City 5921 27718 0.21
White Rock 1327 21027 0.06
City of North Vancouver 30396 57325 0.53

I took TransLink’s data and combined it with the 2019 BC population estimates to get the boardings per capita. The higher the number, the more people in a municipality choose to use transit. This can be due to access to frequent transit routes; a good mix and number of shops, offices, schools and residents along corridors; and, good walking/cycling access to transit.

In the South of Fraser, Surrey had the most boardings per capita followed closely by Langley City. Delta, Langley Township, and White Rock had less than half the boardings per capita as Surrey and Langley City.

I also included the City of North Vancouver in this table. The City of North Vancouver is 11.8 square kilometers which is similar in size to Langley City. Like Langley City, it is also an urban centre. With SeaBus and bus service, the City of North Vancouver has more than double the boardings per capita as Langley City. This shows that we still have room to improve in Langley City.

Langley City’s proposed draft Official Community Plan is focused around building a city with transit and active transportation in mind. As we grow, I believe that we will continue to see more people choose to take transit.

We are in a pandemic right now, but Official Community Plans last for decades. Once we find a cure for COVID-19, people will continue to choose transit as a preferred way to get around in our region.

Monday, August 10, 2020

The Fraser Valley (including Langley) has the highest number of COVID-19 cases in BC

Every week, the BC Centre for Disease Control releases an updated surveillance report for COVID-19 cases throughout the province. There is one set of maps that I have been paying close attention to:

Geographic Distribution of COVID-19 by Health Service Delivery Area of Case Residence. Select map to enlarge. Source: BC CDC

As you can see, Metro Vancouver is divided into five geographical sub-areas. Langley City is in “FS” or Fraser South. Our sub-area has the unfortunate distinction of having the highest number of confirmed COVID-19 cases in Metro Vancouver both in absolute numbers and as a rate per 100,000 population over the last 14 days.

We are right next to Abbotsford, Mission, and Chilliwack which are in “FE” or Fraser East. In the last 14 days, this part of the province had the highest confirmed case count in BC and the highest rate per 100,000 population.

I’ve been following the rolling trend for Fraser South and Fraser East, these Health Service Delivery Areas have seen some of the highest numbers over the last month.

This next table shows the percentage distribution of the population of BC and select COVID-19 statistics by age range.

Percentage distribution of COVID-19 cases, hospitalizations, ICU admissions and deaths by age, compared to the general population of BC, January 1 – August 6, 2020. Select table to enlarge. Source: BC CDC

What is interesting to observe is the relationship between age and COVID-19 cases. People between the age of 20 and 39 are overrepresented when it comes to COVID-19 cases.

While there have been confirmed outbreaks, I have to wonder if some people feel that because they are “healthy” and do not live in the more densely populated areas of the Lower Mainland, that they have a lower chance of coming in contact with other people who could transmit COVID-19.

No matter where you are in BC, we must all follow the same guidelines: Hand washing, distancing, masks, and bubbles. House parties, dinner parties, and games nights are high-risk activities no matter where you live.

I meet up with friends at parks, and we kept our distance. This is a lower risk way to visit friends.

I miss getting together with friends at their homes, but I also do not want to get COVID-19, spread it, or put an older person at risk of hospitalization or death.

I know there are some people that will continue to ignore the recommendations of the BC CDC, but I hope that this number will shrink. While the number of COVID-19 active cases has increased in the last month, the number of hospitalizations has remained stable. This number needs to remain stable.

Thursday, August 6, 2020

Langley has third largest population of people experiencing homelessness though numbers stabilized

Read an updated post about the 2020 Homelessness Count.

Preliminary data from the 2020 Homeless Count in Metro Vancouver was recently released by the BC Non-Profit Housing Association. This count of people experiencing homelessness occurs region-wide every three years. It is a point-in-time sampling of people over a 24-hour period from March 3rd through March 4th.

This report shows a minimum estimation of people visibly experiencing homelessness in Metro Vancouver. The count does not include people who are staying with friends, living in cars, in jail, in hospital, or in locations which people performing the count were not able to enter.

Like the 2017 count, the top three community where people are experiencing homelessness are Vancouver (2,095), Surrey (644), and Langley (209). These three community represent 80% of the people counted.

The following chart shows the number of people experiencing homelessness in Langley since 2005 from the current and past counts.

The largest increase in Langley occurred between 2014 and 2017. In 2020, it appears that the number of people visibly experiencing homelessness has stabilized.

Since 2017, an integrated case management team to support people experiencing homelessness was created for Langley. This team connects people experiencing homelessness with housing. The Creek Stone supportive housing facility has also recently opened.

There is still more work to be done in Langley. 209 people is too much, and we will need the continued support of the provincial government through BC Housing and Fraser Health to get people experiencing homelessness housed and supported.

For more information, please view the full preliminary data report.

Wednesday, August 5, 2020

Metro Vancouver transit ridership sets record in 2019. Fraser Highway Express fastest growing route.

2019 was a record-setting year for transit ridership in Metro Vancouver and in the South of Fraser as is evident in TransLink’s 2019 Transit Service Performance Review.

The top five routes in the South of Fraser serve the Scott Road, King George Boulevard, Fraser Highway, and Guildford-Whalley corridors. The ridership of these tops routes are similar to the top routes in Burnaby/New Westminster.

There has been a myth that people in Surrey, Langley, and White Rock don’t want to take transit. The numbers show that this is a myth. When fast and frequent transit service is provided, ridership significantly increases in South of Fraser communities.

One of the success stories has been the introduction of express and local bus service along the same corridors. This combination of service increases transit ridership.

The first example of this is King George Boulevard with the R1(former 96) and 321. The second example of this is the new 503 and 502 service along the Fraser Highway corridor.

In the fall of 2019, the 503 was upgraded to the Fraser Highway Express. This resulted in a 120% year-over-year increase in boardings, making the 503 the fastest growing bus route in Metro Vancouver. Even with the rapid growth of ridership on the Fraser Highway Express, ridership also increased year-over-year for the local service 502 route.

In Langley, transit routes continued to see increasing ridership in 2019. The following table shows the change in ridership for Langley-focused routes:

Route 2018 2019 Percent Change
502 3,176,000 3,209,000 1%
501 1,521,000 1,799,000 18%
503 740,000 1,627,000 120%
555 1,172,000 1,428,000 22%
531 648,000 752,000 16%
595 449,000 629,000 40%
562 305,000 332,000 9%
372 144,000 194,000 35%
560/561 130,000 139,000 7%
509 96,000 104,000 8%
563 83,000 86,000 4%
564 53,000 63,000 19%

Transit ridership is currently around 50% of 2019 levels due to the COVID-19 pandemic. While 2019 might seem like a different era, ridership numbers show that there is a demand for transit service in the South of Fraser.

COVID-19 has muted that demand today, but when a cure is found, it is good to know that we will have a transit system available to handle new ridership demands.

Tuesday, August 4, 2020

Public Art in Langley City Parks: 5’ Xylophone and Interurban/SkyTrain Mural

Langley City’s Arts and Culture Task Group recommended two new public art installations in our community.

The first piece of public art recommended was an upright 12-note pipe xylophone to be installed near the picnic shelters at City Park.

Front view of Xylophone. Select image to enlarge.

According to the artist Laara Cerman, the xylophone “can be played by people of any age or culture, as music is a language that often crosses these boundaries, and it can be played from either side of the sculpture so two participants can make music together.” This fits in with the City’s Nexus Vision.

Top-down view of Xylophone. Select image to enlarge.

The xylophone will be 5 feet tall, 3 feet wide, and 1.5 feet deep. It will be built with sturdy exterior construction materials. A mallet will be embedded into each pipe on the xylophone.

Mallet emedded into xylophone. Select image to enlage.

The second piece of public art recommended was a mural by artist Judy Pohl to be installed on the exterior of the washroom building at Linwood Park.

Linwood Park is located along Michaud Crescent which was the old Interurban rail corridor that provided passenger and freight service several times a day between Vancouver and Chilliwack up until 1950.

Interurban/SkyTrain Mural. Select image to view.

Judy Pohl, in her description of the mural, notes that the “wraparound mural features Langley City’s flag on two opposite corners joining together the past and future of Langley’s rail travel. On the east side where the washroom doors are located shows the picturesque Langley Prairie with the Michaud farmhouse. The north wall features Langley's old light rail car on the prairie farmlands of the era. On the south and west walls you have our future [SkyTrain] amidst a floral bouquet representing Langley's vibrancy.”

These two public art recommendations were approved by Langley City council on July 27th. The total cost of the Xylophone is $19,544. The total cost of the mural will be no more than $3,000. Both projects are funded from Langley City’s Public Art Fund.