Both Global BC and CKNW covered the third annual Transit Report Card of Major Canadian Regions.
You can see and listen to the stories below.
Wednesday, August 23, 2017
Monday, August 21, 2017
Vacation Alert
I am taking a break from blogging over the next couple of weeks. I will start posting again on Tuesday, September 5th.
Thursday, August 17, 2017
In Conversation: Third Annual Transit Report Card on BIV Radio
| 2017 Transit Report Card of Major Canadian Regions |
Earlier this week, I chatted with Kirk LaPointe and Tyler Orton on Business In Vancouver Radio about the third annual Transit Report Card of Major Canadian Regions which was released on Monday.
We talked about the metrics in the report card, and how transit service in Canada’s major regions compared. The conversation shifted focus to transit service in Metro Vancouver, and how counter to popular conception, TransLink is actually one of the most efficient agencies evaluated in the report card as evident by its Passenger Trip Intensity score. The higher the score, the more closely aligned transit service provided is to demand.
We also chatted about the importance of the bus network in Metro Vancouver, and that while Surrey LRT and the Broadway SkyTrain extension are the focus of attention, more than $550 million is also being proposed for investment in capital improvements and operating costs over a 10-year period to improve bus service, and increase the number of B-Line routes. This has begun with phase one of the Mayors’ plan now being rolled out.
You can listen to the whole interview on the Roundhouse Radio website. The conversation starts around the 35 minute mark.
Wednesday, August 16, 2017
Evening Event Coming to Downtown Langley: Dueling Pianos and Local Craft Beer

Downtown Langley is the heart of our community. One of the areas that both Langley City and the Downtown Langley Business Association have been enhancing is the number of events and activities happening in our core. Whether it is one of the many Saturday events such as the Arts Alive festival or the McBurney Plaza Summer Series, or the weekday Lunch & Lounge, there is an ever increasing list of positive things to do during the day.
By programming our public spaces, it not only builds a strong sense of community, but reduces negative activity (at a fraction of the cost of increased policing.)
While events and activities are increasing during the day in our downtown, the evening is a different story. The City and the merchants are aware of this, and I’m happy to announce that on Saturday, September 9th, an evening event is coming to McBurney Plaza!
Join us in McBurney Plaza for a memorable evening of live entertainment, craft beer, local wine, and delicious street food. Take in the soulful music of Sean Michael Simpson after a quick stop at the Vagabond Bar Truck. Keep your eye out for award winning Magician Travis Bernhardt who will be roaming through the crowd to give you a front row seat to his jaw dropping illusions. Be sure to find a spot near the main stage for the main event, a dueling pianos show, Vegas style! This all request show includes pop, rock, country and comedy. It’s sure to have you singing along to all your favourite songs.
Dueling Pianos in the Plaza is a 19+ event. To purchase your ticket, visit https://www.eventbrite.ca/e/dueling-pianos-in-the-plaza-tickets-36904595639.
All ticket sales proceeds to benefit Langley City Sports - Activities for Children.
This event takes place from 6:00 pm to 10:00 pm, and will be the first of a series of evening events that are in the works for our downtown.
Monday, August 14, 2017
Transit Report Card released. Montreal transit continues to lead in the nation; Toronto and Ottawa transit grades drop
| 2017 Transit Report Card of Major Canadian Regions |
The third annual Transit Report Card of Major Canadian Regions was released today, and the results are mixed. While some regions increased their transit grades, other regions saw their overall score drop.
Transit service in Canada’s major regions has not been able to keep up with population growth. Under-investment by all levels of government has resulted in overcrowding in some areas, and lack of service in others.
“Whether it's elementary school students or transit systems, by the time you get three years of grades you can begin to see the trends. Nathan Pachal has again provided - for Canada's transit networks - the comparisons, the grades and the trends,” says Gordon Price, Fellow at the SFU Centre for Dialogue.
Service hours per capita, transit service per person, has been declining steadily over the last three years reported. The good news, though, is that transit agencies have been doing more with less. Passenger Trip Intensity, a measure of efficiency, has been increasing year over year.
Transit service in the Greater Toronto Hamilton Area and the Ottawa region received “C” grades, dropping from their previous “B” grade. In Toronto, this was due to a drop in transit services hours per capita. In Ottawa, it was due to a decline in Passenger Trip Intensity.
Transit agencies have optimized service every year since the annual transit report card was first published, but there is only so much juice you can squeeze from an orange.
Recently, the federal government and provincial governments have increased investment in renewing transit throughout the country. With this renewed investment, the negative trend should start to reverse.
"Great transit is crucial for building happy, healthy regions,” says Charles Montgomery, award-winning Canadian writer and urbanist. “The Transit Report Card provides a critical view of the state of Canadian transit service. It's a call to action for better transit service in our bigger regions.”
Public transit drives economic growth and prosperity; it also makes people happier and healthier. As shown in this year’s report card, transit service in Canada needs renewed investment.
Thursday, August 10, 2017
Langley City getting good value for money from TransLink in 2016
One of the common comments I hear from people in Langley is that transit service is subpar. While transit service is currently subpar in the Township of Langley, especially in Willoughby and Walnut Grove, the same can’t be said in Langley City.
Langley City had a population of 25,888 in 2016, and is served by 14 bus routes. One route, the 502 which runs along Fraser Highway, is part of the frequent transit network. This means 15 minute or better frequency all-day, every-day, with 5 minute frequency during peak periods. Most other routes through Langley City run every 30 minutes, with more frequent service during peak period.
 |
| A map of the bus routes in and around Langley City. |
To put this into perspective, my hometown of Vernon with a population of 48,073 is served by 8 transit route with the most frequent routes running every 30 minutes.
In 2016, Langley City residents contributed $2.7 million in property tax to TransLink. TransLink also collected a portion of gas tax. While I don’t have the gas tax numbers from Langley City, it is likely in the neighbourhood of $3 million based on the ratio of taxation collected by the agency. So about $6 million in revenue was collected from Langley City residents in 2016. What services did we receive?
Langley City received $759,313 directly from TransLink in 2016. This money was used to maintain the major road network which includes 200 Street, and to fund portions of other projects such as 203 Street.
The follow list shows the transit routes that serve Langley City and their 2016 operating costs:
320: $3.2 million
342: $1.9 million
364: $1.6 million
395: $0.4 million
501: $2.5 million
502: $4.3 million
503: $2.4 million
531: $1.3 million
595: $1.2 million
C60: $0.3 million
C61: $0.3 million
C62: $0.7 million
C63: $0.3 million
C64: $0.3 million
This totals to around $20 million in bus service provided through Langley City. These routes also serve the Township, Surrey, and White Rock. The numbers shows that we are getting a good deal when it comes to transit service through Langley City.
A new Fraser Highway B-Line is coming in the next few years which will go to Downtown Langley. Rail rapid transit is also in the works to Downtown Langley.
Langley City is a regional centre in Metro Vancouver, and this is evident in the level of transit service we receive in our community.
Wednesday, August 9, 2017
Addressing Delta’s facts about the George Massey Tunnel
Mayor Lois Jackson and the Corporation of Delta have been lobbying hard for the Massey Tunnel replacement bridge. Mayor Jackson has been lobbying the province, lobbying the Mayors’ Council on Regional Transportation, and recently Mayor Jackson appeared as a delegation to lobby the Metro Vancouver Regional District board.
Delta council also approved a $35,000 advertising campaign promoting their case for the bridge. The problem is some of their points used to justify the bridge do not correlate with reality.
Delta believes the project should continue, regardless of the cost, based on the following:
- Action is needed to alleviate tunnel congestion
- Transit needs to be improved along the corridor
- The current tunnel is seismically unsafe
In 2009, the provincial government released a report titled, “Highway 99 (King George Highway to Oak St. Bridge) Corridor Assessment.” The report noted that “although the numbers of buses on the corridor represent less than 1% of the vehicular demand, the person demand accommodated by buses on the highway ranges from 17% to 26%.”
Transit moves a large number of people along the Highway 99 corridor with minimal road space. At the time of the report, the provincial goal was to move 50% of people along the corridor during peak travel periods by transit. The total cost was around $100 million to build transit priority measures along the whole corridor.
If you travel along the Highway 99 corridor today, you’ll see the bus lanes and bus queue jumper lanes at the tunnel which were implemented as a result of the recommendations made in that 2009 report.
Vehicle volume through the George Massey Tunnel has been declining according the provincial government's own data.
Continuing on with the recommendations of the 2009 report would further reduce tunnel congestion and improve transit along the corridor. While not part of the 2009 report, in the future, a transit/HOV tunnel could be considered to ensure that people can continue to move efficiently along that corridor.
The tunnel is safe. The provincial government completed $18.7 million in seismic safety retrofits of the tunnel in 2006. In 2001, the provincial government invested $25 million in seismic upgrades to the tunnel.
There are more cost-effective solutions to ensure that people and goods continue to move along the Highway 99 corridor. The reasons that Delta is using to justify the bridge were being, and can continue to be, addressed without a $3.5+ billion bridge.
Tuesday, August 8, 2017
Improving walkability along the Langley Bypass. Taking a page from Nanaimo’s OCP
Over the BC Day long weekend, I passed through Nanaimo, heading north towards Campbell River and Quadra Island. Back in the late 1980’s, my family lived in Gold River, so it was interesting to see what has changed in the last quarter-century. This was the first time I’ve been back since that time.
While I don’t remember the absence of big box retail from my childhood memories of these areas, one of the big things I did notice on this trip was the number of strip malls and power centres on Vancouver Island. Based on the location and architecture of these retail locations, many of them looked like they were built at the beginning of the 21st century.
The Langley Bypass area is big-box central, and is not a pleasant environment for walking or cycling. Even with this, I see people walking and cycling in this part of town. Nanaimo’s "Langley Bypass" is Highway 19A. This corridor runs for about 10 kilometres, and it makes the Langley Bypass look quaint.
The Highway 19A corridor does have a trail that runs parallel, but connectivity between the trail and services along the corridor is limited. Highway 19A is owned by the provincial government, and just like the Langley Bypass, the provincial government has the ability to dictate zoning within 800 metres of these highways.
 |
| The Highway 19A corridor through Nanaimo |
A modern, efficient transportation system is one where people can feel comfortable walking or cycling, where quality transit is available, and driving is a choice. Back in 2008, Nanaimo city council adopted a new Official Community Plan (OCP). The vision in this plan is to transform the Highway 19A corridor into multi-modal, mixed-use corridor over time.
While the plan talks about building mixed-use projects with retail on the ground-level, and residential above, it also talks about large-format retail. How does Nanaimo plan on making large-format retail accessible to people no matter the mode of travel chosen? According to their OCP:
The redevelopment of any Corridors to improve automobile travel shall also consider improvements that add to the human scale of the corridor, increase the proportion of landscaping and green space, and improve safety for non-motorized travelers. Sidewalk and landscaping design will enhance pedestrian and vehicle separation.
The development of primary parking areas between the front face of the buildings and the street in Corridors is not permitted.
In some locations, the OCP requires that “any large format retailing will be required to implement street oriented design formats that create vibrant and accessible streetscapes for pedestrians.”
Some of the requirements in Nanaimo’s OCP, as it relates to large-format retail, could also be applied in Langley. The Langley Bypass could be improved, and with a rapid transit stop planned near Fraser Highway and the Langley Bypass, now is a good time to think about the future of that corridor. If Nanaimo’s vision is to transform a strip mall and big box corridor into a more accessible place, certainly we can do the same in Langley.
Thursday, August 3, 2017
Bus service speeds are slowing down throughout Metro Vancouver. Find out why the 96 B-Line is not.
Early last month, I posted about TransLink’s 10 Year Plan for transit expansion and transportation improvements throughout our region. This plan is currently being implemented, and there is more bus service today thanks to these improvements which started in earnest last year.
As I noted at the time, about 25% of the new bus service hours being implemented are to combate congestion to ensure that buses can continue to run on-time. Congestion is increasing in our region, but even with this increasing congestion, there are ways to ensure that buses can stay on-time, and service doesn’t slow to a crawl.
When it comes to bus service speed there are a few factors at play. The first is how many stops a bus makes. For regular bus service, the more stops a bus makes, the slower the route becomes. Another factor that impacts bus service speed in how many people board/disembark at each stop. The more people, the longer a bus needs to dwell at a stop. The third factor that impacts bus speed is the number of other vehicles that are using the same lane as a bus; regular old congestion.
What can be done to ensure that bus service speeds don’t slow down? Limited stop service, like the B-Lines, combat the first challenge with stops. The second challenge can be combated with off-bus ticketing. For example, on some routes in Seattle, you can tap in at the bus stop.
 |
| An example of off-bus ticketing from Seattle. |
Giving buses a way out of congestion takes the help of local governments. For example, TransLink’s data shows that the 96 B-Line which runs along King George Boulevard and 104 Avenue has maintained a consistent service speed of around 23km/h since its introduction in 2013. As shown in the following pictures, Surrey has also invested in bus queue-jumper lanes in key areas to get buses out of congestion.
 |
| A bus priority lane along King George Boulevard. Source: https://twitter.com/SkyTrain4Surrey/status/644307139792535552 |
 |
| A bus using a queue jumper lane along King George Boulevard. Source: http://www.surrey.ca/city-services/7585.aspx |
The 321 which is a local bus that is subject to all three slow-service factors operates along King George Boulevard. It has maintained its service speed at an average of 27km/h over the years.
The 503 is a limited stop service that runs along Fraser Highway. Its service speed has reduced from an average of 35 km/h in 2014 when the service first started, to an average of 34 km/h in 2016.
The 502 is a local bus that runs along Fraser Highway. Its service speed has reduced from an average of 29 km/h in 2013 to 26 km/h in 2016.
I take the 502 or 503 daily, and can attest that the biggest factor in slow service is congestion along some sections of Fraser Highway. Like Surrey did along King George Boulevard, bus priority lanes in certain sections of Fraser Highway should be built.
Municipalities and TransLink must work together to ensure that buses have a way out of congestion by adding queue jumper lanes, bus lanes, and even off-bus ticketing where required to speed up service. These are all capital costs that will reduce operating costs and help keep buses running on-time.
25% is a big number. Just imagine what service improvements could be implemented if TransLink didn’t have to use precious service hours to deal with congestion.
Note: Bus speed data is from TransLink’s recently released 2016 Transit Service Performance Review.
Wednesday, August 2, 2017
The high cost of developing rural land. Sewerage fees increasing in Metro Vancouver.
When people think of what infrastructure is required to build and sustain a growing region, thoughts of streets, parks, garbage/recycling service, and lighting come to mind. Of course, water, sewer, and other utilities are required, but because they are usually buried underground, they are out of sight and out of mind.
Clean water and sewer treatment are the basic requirements to ensure that public health is maintained. Providing these services in a growing region like Metro Vancouver is not without cost. The Metro Vancouver regional district builds and operates the main water and sewer networks in our region. For more information on who provides services in our region, check out an infographic posted to this blog.
The regional district maintains a network of wastewater treatment facilities and sewer mains which are divided into four disconnected areas as shown on the following map.
 |
| Map of Metro Vancouver sewerage areas. Select map to enlarge. |
Most of the region, including the South of Fraser, is in the Fraser Sewerage area. This sewerage area also services the fastest growing parts of our region which means that major investment is needed to keep up with demand.
Metro Vancouver has recently published a list of sewerage projects that are required to accommodate the growing population in our region. For the Vancouver area, $49 million in projects are required. $3.5 million in projects are required in the North Shore area. $53 million in projects are required in the Lulu Island (Richmond) area.
For the Fraser Sewerage area, a staggering $2.6 billion in projects are required over the next 25 years to accommodate growth. Many of these projects in the Fraser Sewerage area are to support rapidly urbanizing, former rural areas. 96% of all sewerage projects to accommodate growth in our region will be built in the Fraser Sewerage area over the next 25 years.
In our province, these types of projects are paid for by development cost charges. This means that for every new housing unit or square foot of commercial/industrial property built, the developer must pay the regional district a fee.
Because of the level of investment needed in the Fraser Sewerage area, Metro Vancouver is proposing a significant increase in these development fees as noted in the following table.
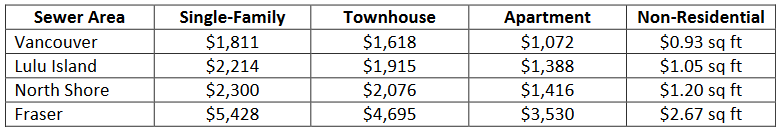 |
| Proposed Development Cost Charges for sewerage, by area. Select table to enlarge. |
Because Metro Vancouver has different rates for different parts of our region, it highlights how it is costlier to build out a sewer network due to sprawl as opposed to redevelopment. Unfortunately, because of the size of the Fraser Valley sewerage area, it means that development projects in New Westminster are paying for the cost of service expansion in South Surrey.
While it may be less money for a developer to build in rural areas, it costs society more. Sewer service is just one of many examples of this.
Tuesday, August 1, 2017
Langley City Crime Prevention Task Group: promoting CPTED reviews, Block Watch, and Business Watch
Last Thursday, the Langley City Crime Prevention Task Group met. You can read about the work that the task group has completed to date by reviewing my posts about the May and the June meetings. At this most recent meeting, we reviewed what the City does to promote Crime Prevention Through Environmental Design (CPTED).
Gerald Minchuk who is the Director of Development Services and Economic Development provided an overview of how the City requires that CPTED principles be incorporated into all new apartment, townhouse, commercial, and industrial development projects. He also reviewed the work that the City does to incorporate CPTED princples into our own facilities such as Douglas Recreation Centre and Al Anderson Memorial Pool.
While CPTED principles are incorporated into new development projects, our City was built-out long before CPTED was a thing. One of the mandates of the task group is to promote CPTED, included spaces that currently aren’t following CPTED principles. The RCMP currently offers free CPTED reviews; the task group wants to promote the availability of these reviews. The task group, along with City staff, is looking at including information about these CPTED reviews as part of the business license renewal process.
The task group also passed a motion that will be reviewed at a September council meeting, asking that council consider promoting the RCMP’s free CPTED review program, Block Watch program, and Business Watch program in partnership with the Downtown Langley Business Association, Greater Langley Chamber of Commerce, and the local media. The task group also asked council to consider a social media advertising campaign to promote these programs and provide CPTED tips.
One of the things that the task group heard from the RCMP is that they want to know about all suspicious or unsavoury activities, even if an immediate police response is not required. They want people to call their non-emergency number to report these activities. To help promote the non-emergency number, the task group passed a motion requesting that council consider purchasing 5,000 fridge magnets that will be distributed free-of-charge to residents in our community. The magnet distribution program would be geared towards seniors.
There was also discussion at the meeting about developing a phone app that could be used to report issues to the City, and provide the RCMP non-emergency number. More discussion on this idea will occur in the fall.
The task group also heard from Dave Selvage who is the manager of the City’s bylaw enforcement department. He reviewed how the department is working towards an integrated approach with the RCMP and other service agencies to target problem areas in our community where negative activity occurs.
The next Crime Prevention Task Group meeting will be in September.
Subscribe to:
Posts (Atom)