Showing posts with label White Rock. Show all posts

Thursday, March 20, 2025

Accommodating Population Growth Requires a Plan, Invest Langley City

In February, BC Stats released the last population estimates for municipalities in BC. While looking at the year-over-year changes is interesting, there is value in looking over a more extended period. I wanted to look at the population growth of municipalities in the South of Fraser over the last few decades.

The following is the change in population between 2004 and 2024 by municipality:

  • Surrey - 80%
  • Langley Township - 73%
  • Langley City - 44%
  • White Rock - 32%
  • Delta - 26%

One of the challenges with fast growth is keeping up with services. Building new cultural and recreation facilities takes time and considerable finances. For example, it is easier for Delta to plan for and build these facilities than Surrey. Surrey is always in catch-up mode.

Langley City's growth is "middle of the road" for South of the Fraser communities, but we still must invest in facilities to keep up with growth. We will need to expand basic facilities like our operations and maintenance yard as well as recreation and cultural facilities. With SkyTrain, population growth will accelerate, which is why Langley City Council is creating our Invest Langley City vision. This vision will outline when and what we need to build to ensure that our residents and businesses continue receiving a high service level. I'll be sharing more about this vision as it progresses.

Wednesday, September 7, 2022

Let’s drop the spaghetti-mess transit network and invest in fast, direct service

TransLink bus

Around 15 years ago, TransLink introduced the South of Fraser Area Transit Plan. The big idea in that plan was to shift the transit network focused on getting people from “the suburbs” to Downtown Vancouver, to a network that gets people easily around Surrey, Delta, White Rock, and Langley with fast and direct bus service.

The bus network at the time was more a spaghetti mess of infrequent transit routes that were not intuitive to use. The following map shows the 2008 transit network in Langley.

Example of spaghetti-mess routes in Langley back in 2008. Select map to enlarge.

Back then, the 502 and 501 even had different routings based on the time of day. You almost needed to be a transit expert!

While some of the spaghetti-mess network still exists today, and there are still very infrequent or peak-period only routes such as 388 or 509, TransLink has invested in creating direct, easy-to-understand routes over the past decade or so.

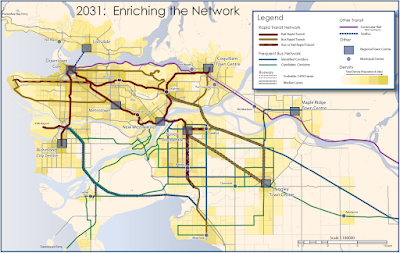
The big idea of the South of Fraser Area Transit Plan was that you could use a grid of frequent bus routes to get from any point to any point in the South of Fraser with only one transfer. Because the routes were frequent, you’d never have to wait more than 15 minutes for a bus. You usually wait less.

2031 proposed fast and frequent transit network from the 2007 South of Fraser Area Transit Plan, Phase 1. Select map to enlarge.

One of the biggest success stories of investing in direct, frequent, and easy-to-understand transit routes is the 531, which connects White Rock/South Surrey to Langley. This route has been leading in ridership growth.

I’ve now been on several 531 that have been jam-packed this year.

About five years ago, the 501 would almost act like an express bus along 200th Street, when I took the 501 this weekend, it was busy, and people were getting on and off at many stops along the route.

I’ve seen firsthand how valuable this direct network can be as the population and jobs in the South of Fraser grows.

With overall transit ridership still below pre-pandemic levels, TransLink has the opportunity to evaluate the transit network. It might be a good time to assess if peak-period, Vancouver-bound commuter transit routes are meeting the needs of people, especially in the South of Fraser. Does it make sense to reallocate funds from peak-period-only Vancouver commuter specials and other infrequent, spaghetti-mess routes to strengthen the frequent, direct transit network?

From what I’ve seen, the answer is yes.

Monday, January 17, 2022

Langley City Protective Services Expenditures One of Highest in Metro Vancouver

Community Policing Office

Protective services are the top category of expenditures for Langley City. Protective services include policing services, fire and rescue services, Langley Youth & Family Services, dog control, emergency planning, search & rescue, and victim/witness services.

How does Langley City compare to other municipalities in Metro Vancouver?

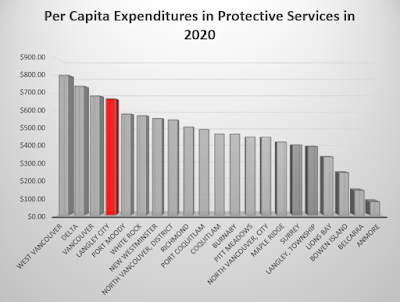
Per capita expenditures in protective services in 2020. Select chart to enlarge.

Langley City has one of the highest per capita expenditures for protective services in Metro Vancouver at $670.26 in 2020, the year where the latest information is available region-wide.

Our neighbours in the Township paid $396.63 per person, and in Surrey, $404.78 per person.

The following table shows the breakdown for all municipalities in Metro Vancouver.

Municipality Population Cost Per Capita
   West Vancouver 43805 $35,276,293.00 $805.30
   Delta 111281 $82,645,612.00 $742.67
   Vancouver 697266 $478,747,000.00 $686.61
   Langley City 27774 $18,615,742.00 $670.26
   Port Moody 35151 $20,472,997.00 $582.43
   White Rock 20922 $11,992,616.00 $573.21
   New Westminster 82590 $46,027,403.00 $557.30
   North Vancouver, District 89767 $49,232,455.00 $548.45
   Richmond 216046 $109,703,763.00 $507.78
   Port Coquitlam 63508 $31,353,478.00 $493.69
   Coquitlam 152734 $71,349,595.00 $467.15
   Burnaby 257926 $120,277,532.00 $466.33
   Pitt Meadows 19717 $8,876,997.00 $450.22
   North Vancouver, City 58985 $26,534,131.00 $449.85
   Maple Ridge 91479 $38,567,159.00 $421.60
   Surrey 598530 $242,273,000.00 $404.78
   Langley, Township 133302 $52,872,000.00 $396.63
   Lions Bay 1357 $456,089.00 $336.10
   Bowen Island 3982 $977,738.00 $245.54
   Belcarra 673 $96,440.00 $143.30
   Anmore 2412 $189,186.00 $78.44

Source: BC Population estimates and BC Municipal general and financial statistics.

Tuesday, August 11, 2020

Langley City and Surrey had highest transit usage in the South of Fraser

As I posted about last week, the number of people that used transit set a record in 2019. I also noted that the new 503 Fraser Highway Express which has limited stops between Surrey Central and Langley City, and provides local service to Aldergrove, was the fastest growing route in Metro Vancouver. This information is contained in TransLink’s 2019 Transit Service Performance Review.

TransLink has provided information on transit ridership by municipality, sub-region, transit service type, and route. The following table shows the average weekday boarding by municipality in 2019.

Municipality Average Daily Boardings Population Boardings Per Capita
Surrey 156717 584526 0.27
Delta 11072 109490 0.10
Langley Township 10768 130924 0.08
Langley City 5921 27718 0.21
White Rock 1327 21027 0.06
City of North Vancouver 30396 57325 0.53

I took TransLink’s data and combined it with the 2019 BC population estimates to get the boardings per capita. The higher the number, the more people in a municipality choose to use transit. This can be due to access to frequent transit routes; a good mix and number of shops, offices, schools and residents along corridors; and, good walking/cycling access to transit.

In the South of Fraser, Surrey had the most boardings per capita followed closely by Langley City. Delta, Langley Township, and White Rock had less than half the boardings per capita as Surrey and Langley City.

I also included the City of North Vancouver in this table. The City of North Vancouver is 11.8 square kilometers which is similar in size to Langley City. Like Langley City, it is also an urban centre. With SeaBus and bus service, the City of North Vancouver has more than double the boardings per capita as Langley City. This shows that we still have room to improve in Langley City.

Langley City’s proposed draft Official Community Plan is focused around building a city with transit and active transportation in mind. As we grow, I believe that we will continue to see more people choose to take transit.

We are in a pandemic right now, but Official Community Plans last for decades. Once we find a cure for COVID-19, people will continue to choose transit as a preferred way to get around in our region.

Thursday, October 10, 2019

Sustainable transportation usage up in the South of Fraser. Walking way up.

TransLink recently released the results of its 2017 trip diary. This is a region-wide survey that has occurred for decades measuring how people get around in our region. These trip diaries were completed in 1994, 1999, 2004, 2008, 2011, and most recently in 2017.

These diaries are surveys, so they are based on a representative sampling of people in our region. For the 2017, TransLink adjusted the way it determined this sampling of people to “reduce transit bias due to the oversampling of transit users.” While TransLink adjusted the 2011 data as a result, data from previous years cannot be used in an “apples-to-apples” comparison.

While TransLink provides information by municipality, this is a regional survey. This means that municipalities like Langley City and White Rock have a small sampling of people which means that the accuracy for these municipalities is not as robust as at the regional or sub-regional level. This is why I only want to share information from the sub-regional level.

The South of Fraser which includes Surrey, Langley, and White Rock has seen an increase in sustainable transportation modes. These modes include walking, cycling, and transit. In 2017, 17.3% of all trips used sustainable modes.

Trips by mode in the South of Fraser (percent). Select chart to enlarge. 

Cars take up a lot of space. As our population continues to grow, we don’t have the space to widen or build more roads and parking lots in our region. Municipalities must invest in sustainable modes of travel. It is encouraging to see that sustainable transportation mode share is increasing in the South of Fraser.

It is also interesting to look at why people are travelling. While much attention is placed on commuting, the fastest growing reasons why people travel are for escorting and shopping. Escorting includes things like getting kids to soccer practice, and getting a parent to the doctor’s office.

Trips by purpose in the South of Fraser (total number). Select chart to enlarge.

One of the things we need to do as local governments is design our communities so that it is easier for people to do these personal trips via sustainable modes of travel. We need to design our communities to make walking to shopping easy, and our streets and parks in ways that parents feel safe letting their children bike to soccer practice on their own.

While many people believe that a majority of trips cross the Fraser River, they simply don’t. Around 90% of trips that start in the South of Fraser, stay in the South of Fraser.

For more information, please look at TransLink’s Tableau visualizations.

Thursday, November 8, 2018

Property Tax, TransLink, and funding the major road network in the South of Fraser

When most people think of TransLink, it’s buses and trains that come to mind. What many people don’t know is that TransLink is also responsible for enhancing and maintaining the major road network, and funding projects that support improving cycling and walking in the region.

Map of the Major Road Network in the South of Fraser. TransLink funded roads are in blue. Select map to enlarge. Source: TransLink

In Langley City, TransLink helps fund the maintenance of 200th Street, and sections of the Langley Bypass and Fraser Highway. TransLink is also responsible for the 204th Street Overpass. In addition, our community has received funding for projects such as for the 203rd Street corridor enhancements.

TransLink has three major sources of revenue: fares, fuel tax, and property tax. The following chart shows the amount of property tax that the agency received from municipalities in the South of Fraser in 2017.

Property Tax 2017
Delta $14,131,700
Langley City $2,699,413
Langley Township $12,801,000
Surrey $43,692,000
White Rock $2,210,261

The following table shows the funding that TransLink provided in 2017 to South of Fraser municipalities to fund the major road network, and other cycling and walking projects.

Road Network, Cycling, and Walking Funding 2017
Delta $2,834,243
Langley City $871,865
Langley Township $5,235,952
Surrey $10,000,757
White Rock $69,000

This final table shows the percentage of property tax directly collected in each municipality that is used for road, cycling, and walking projects in that community.

Percentage Returned to Communities 2017
Delta 20%
Langley City 32%
Langley Township 41%
Surrey 23%
White Rock 3%

Around a quarter of property tax revenue is invested directly into non-transit projects by TransLink in the South of Fraser.

The majority of funding does go into transit service. In Langley, we get more transit service than we fund via property tax and gas tax. For more information, please look at an infographic I created a few years back.

Monday, August 20, 2018

Increased bus service for the South of Fraser coming in September


TransLink updates its transit service schedule four times per years. On Tuesday, September 3rd, transit service will be adjusted. Thanks to the approval of phase one and two of the 10-Year Vision for Transportation Improvements by the Mayors’ Council, these service changes now result in increased transit service.

One of the best ways to improve the usefulness of transit for the greatest amount of people is by increasing frequency on bus routes. From personal experience, it is a lot easier to plan your life when you don’t have to plan for when the next bus will arrive.

Increasing frequency encourages more people to take transit which generally leads to even more bus service being added; this is a virtuous cycle.

While TransLink’s defines frequent transit service as routes that run every 15 minutes or better for most of the day, increasing regular bus routes from 1 hour to 30 minutes, or 30 minutes to 20 minutes, improves the transit experience.

With that in mind, I am happy to see that TransLink is continuing to invest in increasing the frequency of regular bus routes in the South of Fraser. The following highlights some of the changes that will come into effect in the next few weeks.

319 Scott Road Station/Newton Exchange: Every 12-20 minutes from 5pm to 1am, increasing from every 15-30 minutes, on Saturday.

320 Surrey Central Station/Guildford/Fleetwood: Every 12 minutes from 6am and 8am, and 4pm to 7pm, on weekdays. An increase from every 15 minutes.

321 Surrey Central Station/Newton Exchange/White Rock Centre/White Rock South: Every 12 minutes between 4pm and 6pm on weekdays. An increase from every 15 minutes.

323 Surrey Central Station/Newton Exchange: Every 15 minutes between 6am and 8am, every 12 minutes between 4pm and 7pm, and every 20 minutes between 7pm and 8pm.

337 Fraser Heights/Guildford/Surrey Central Station: Every 12 minutes between 7am and 8am. An increase from every 15 minutes.

555 Lougheed Station/Carvolth Exchange: Every 20 minutes between 9am and 2pm on weekdays. An increase from every 30 minutes. On Saturday, service will be increasing from every 30 minutes to every 20 minutes between 10am and 5pm.

Monday, July 9, 2018

South of Fraser sees largest percent growth in bus ridership in Metro Vancouver

The TransLink 2017 Transit Service Performance Review was recently released; transit ridership is continuing to increase rapidly in the South of Fraser. There were 43,311,000 annual bus boardings in 2017 which was up 8% compared to 2016. Even in South Delta, which includes Ladner and Tsawwassen, annual boardings was up 9%. Overall, bus transit ridership is growing faster in communities south of the Fraser River than anywhere else in Metro Vancouver.

Annual Bus Boardings by Sub-Region from 2013 to 2017. Select table to enlarge.

In the Performance Review, the 319, 363, and 96 B-Line were noted as seeing the strongest growth in the South of Fraser. As a daily user of the 502, I’ve noticed that this route has become somewhat less crowded. Due to more bus services along the route, the 502 is no longer in the top 10 most over-crowded routes in the region.

Top 5 Routes - South of Fraser Annual Boardings System-Wide Rank
319 - Scott Road Station/Newton Exchange 5,193,000 16
96 B-Line - Guildford Exchange/Newton Exchange 5,019,000 17
502 - Surrey Central/Langley Centre 2,833,000 31
321 - Surrey Central/White Rock 2,550,000 34
335 - Surrey Central/Guildford/Newtown Exchange 2,508,000 36

The 319 is the most utilities bus route in the South of Fraser, travelling along Scott Road. This corridor is in desperate need of B-Line service, and thanks to the recent approval of phase two of TransLink’s 10-Year Investment Plan, service is scheduled to start by 2021.

Annual Bus Service Hours by Sub-Region from 2013 to 2017. Select table to enlarge.

The performance review shows that there was a 23% decrease in bus ridership in the Northeast Sector. This was due to the 97 B-Line being replaced with the Evergreen Extension of SkyTrain.

All TransLink services saw an increase in ridership expect for the West Coast Express in 2017. This was due to the opening of the Evergreen Extension of SkyTrain. The following table shows that ridership at stations such as Maple Meadows, Port Haney, and Mission City increased in boardings. In fact, Mission City saw a 17% increase in boardings in 2017.

West Coast Express Average Weekday Boardings, Fall 2016 and Fall 2017. Select table to enlarge.

TransLink has been able to invest in improving bus service in Metro Vancouver over the last few years due to new funding being approved by local, provincial, and federal governments. “Build it and they will come” is certainly the case for transit service in Metro Vancouver.

Wednesday, May 16, 2018

New index shows state of housing costs for renters in the South of Fraser

Ensuring that everyone can afford a place to live is one of the biggest challenges that our region has ever faced. Whether looking to own a home, rent at market rates, or get into some form of subsidized housing, most people are feeling the pressure.

The Canadian Rental Housing Index is put together by the BC Non-Profit Housing Association. It looks at rent affordability throughout Canada. The index was recently updated with the latest census data, and includes information at the municipal, regional, provincial, and federal levels. What does the index say about South of Fraser communities?

Langley City has some of the lowest household incomes in Metro Vancouver. The following chart shows the average and median gross incomes for renter households in 2016.

Average & Median Incomes in 2016: The average and median gross incomes of renter households. Select chart to enlarge.

The next chart shows the average monthly rent and utility costs in 2016.

Average Monthly Rent and Utilities in 2016: Includes heat, hot water, and electricity. Select chart to enlarge.

Langley City had some of the lowest housing costs in the South of Fraser, but because we also have the lowest household income levels, close to half of Langley City renter households are spending more than 30% of their income on housing. This means that these households are overspending on housing. Between 2016 and this year, the cost of housing has increased, so I would expect that the number of renter households that are overspending on housing costs is now larger.

Overspending in 2016: Households spending more than 30% of their before-tax income on rent and utilities are generally considered to be living in unaffordable situations. Select chart to enlarge.

Transportation is a critical component when it comes to affordability. In communities where driving is the only option, transportation costs can equal a third of housing costs. While in community where walking, cycling, and public transit are viable options, transportation costs can equal about a quarter of housing costs.

Transportation costs are not presented in this index. In the future, it would be good to see transportation costs also included.

The provincial government has recently put measures in place to address creating more affordable transportation and housing options. It will be interesting to see what impacts these policies will have over the next several years.

Monday, December 4, 2017

People in the South of Fraser spend way more time commuting on public transit than rest of region

On Thursday, I posted about transit mode share in Metro Vancouver, focusing on South of Fraser communities. The most recent 2016 census data shows that more people are choosing to take transit to get to work than ten years ago. In the South of Fraser, transit mode share growth is occurring at a greater rate than the regional average.

One of the key metrics for commuting is how long it takes to get to work. In Metro Vancouver, the average one-way commute to work by car is 27.3 minutes. With active transportation options such as walking or cycling, the average one-way commute to work is 17.4 minutes in our region. On average, people spend 43.6 minutes on transit getting to work in Metro Vancouver. How do South of Fraser communities compare to regional averages?

Average commuting duration in Metro Vancouver with a focus on the South of Fraser. Select chart to enlarge. Source: 98-400-X2016324 Data tables, 2016 Census.

For commuting by car, the South of Fraser is comparable to the rest of the region. Active transportation commute times are below the regional average outside of Langley City and Surrey. What really stands out is average commuting time on public transit.

Excluding Tsawwassen First Nation, which is an outlier, the average one-way commute on public transit in South of Fraser communities is 56 minutes. This is 28% higher, or 13 minutes longer, than the regional average. The South of Fraser lacks rapid transit throughout the vast majority of the sub-region. With rail rapid transit in the works along King George, 104th, and Fraser Highway, I would expect commute times to decrease once it is built-out.

Thursday, November 30, 2017

South of Fraser transit mode share growing faster than rest of Metro Vancouver

Statistics Canada recently released information on the primary mode of transportation that people use to get to work.

Over the last decade, there has been serious investments made into public transit in Metro Vancouver, and within the South of Fraser. These investments are paying off.

Commute to work by public transit in Metro Vancouver and the South of Fraser. Select chart to enlarge. Source: 2006 Community Profiles, 2016 Census Profile.

More people are choosing transit as their primary mode of getting to work. In Metro Vancouver, transit mode share has grown by 23% in the last decade. Transit mode share has grown 35% in the South of Fraser, faster than the regional growth rate.

Commute to work by public transit in South of Fraser communities. Select chart to enlarge. Source: 2006 Community Profiles, 2016 Census Profile.

Within the South of Fraser, the Township of Langley has seen the largest growth in transit mode share of any municipality, up 40%. Interestingly, White Rock saw a 13% decline in transit mode share.

TransLink’s numbers show that transit ridership is growing faster than population growth in our region. This is corroborated by Statistics Canada census data.

Tuesday, March 28, 2017

Increased bus service coming to the South of Fraser April 24th

With TransLink’s 10-Year Vision for transit and transportation improvements in full-swing, starting April 24th, there will be improvements made to bus service throughout the region. This is the first round of bus service improvements with more transit service improvements in the works.

There following list shows the bus service improvements for the South of Fraser:

301 Richmond Brighouse/Newton Exchange
Weekday service to operate every 15 minutes, up from 20 minutes, from 6-9 am and 3-5 pm.

311 Scottsdale/Bridgeport Station
Weekday service to operate every 15 minutes, up from every 20 minutes, from 6-7 am.

319 Scott Road Station/Newton Exchange
Increased weekday service from 6-9 am, and 3 pm-12 am.

335 Surrey Central/Newton Exchange
Weekday service between Surrey Central Station and Guildford Exchange to every 8 minutes from 4-6 pm; increased Saturday service to every 20 minutes, up from every 30 minutes, from 4-8 pm; and, increased Sunday/holiday service to every 20 minutes, up from every 30 minutes, from 5-7 pm.

375 White Rock Centre/Guildford
One additional bus trip on weekdays at 10:48 pm, and two additional trips on Saturdays at 9:50 pm and 10:50 pm.

501 Surrey Central/Langley Centre
Increased weekday service from 7:30 pm-10:30 pm to operate every 30 minutes, up from every 60 minutes.

502 Surrey Central/Langley Centre
Increased weekday service from 7-10 am and 3-9 pm; Saturday service runs every 12 minutes, up from every 15 minutes, from 9 am to 7 pm; and, new late night service every 30 minutes Monday to Saturday from midnight to 2 am.

555 Lougheed Station/Carvolth Exchange
Improved weekday service from 6-9 am and 3-8 pm.

601 South Delta/Boundary Bay/Bridgeport Station
Increased weekday service every 20 minutes, up from 30 minutes, on the weekend between 10 am and 6 pm.

C50 Ocean Park/Peace Arch Hospital
Increased weekday service to every 30 minutes, up from every hour, from 6 am to 3 pm.

C51 Ocean Park/White Rock Centre
Increased weekday service to every 30 minutes, up from every hour, from 9 am to 3 pm.

C52 Seaside/White Rock Centre
Increased weekday service runs every 30 minutes, up from every hour, from 9 am to 3 pm.

C53 Cranley/White Rock Centre
Increased weekday service runs every 30 minutes, up from every hour, from 9 am to 3 pm.

C73 Guildford/Surrey Central Station
Increased weekday afternoon peak services to run every 20 minutes.

For more information, be sure to check out TransLink’s website starting March 31st.

Monday, February 20, 2017

Population changes in the South of Fraser and Langley

Earlier this month, Statistics Canada released population and dwelling counts from the 2016 census. Throughout the rest of the year, the agency will be releasing further data from the most recent census.

While population in the South of Fraser has grown significantly, it hasn't been evenly distributed. The population in the Township of Langley has increased by 12.6% due to massive growth in Willoughby. Surrey’s population has increased by 10.6%. Langley City’s and White Rock’s population increased by 3.2% while Delta had a population increase of 2.4%.

Communities like White Rock and Langley City are unique because they have already been built-out. All new growth is from urban redevelopment.

In Langley City, the overall population increased by 807 people. Langley City is divided by the Nicomekl River. Single-family housing is located south of the Nicomekl, while the area north of the Nicomekl is zoned for apartments, townhouses, mixed-use, commercial, and industrial.

Single-family neighbourhoods in Langley City saw a population decrease of 40 people. The following map is from Census Mapper.

City of Langley: Area highlighted in blue had an increase in population of 698. Source: Census Mapper.

The area highlighted in blue saw the largest population increase in Langley City with 698 people. This is an area in the City which is being redeveloped from single-family housing to townhouses and apartments. All other north of the Nicomekl neighbourhoods had population increases.

Overall, the highest concentration of growth in the South of Fraser was in Willoughby between the 2011 and 2016 census.

Township of Langley: Area highlighted in blue had an increase in population of 8,703. Source: Census Mapper.

To find out the change in population in your neighbourhood, I suggest that you check out Census Mapper.

Tuesday, June 7, 2016

Could you afford to rent a two bedroom apartment? Affordable housing and income - Part 2

Yesterday, I posted about household income bands and how that relates to affordable housing in South of Fraser communities. Based on income, what type of unit could a household rent in the South of Fraser? I had a look at information in the March 2016 edition of the Metro Vancouver Housing Data Book as well as the CMHC Fall 2015 Rental Market Report to put together the following table.

2015 median rents by housing type in South of Fraser communities plotted with affordable rental maximums based on income bands. Select chart to view.

The information for Bachelor to 3+ Bedroom is for purposed-built rental apartments. The information for 3+ Townhouse is for three or more bedroom private townhouse rentals. Surrey was the only location in the South of Fraser with reliable townhouse rental data.

What becomes clear is that if your total household income is less than $30,000, you are pretty much priced out of the private market. If your household income is between $30,000 and $39,999, you could afford a 2 bedroom apartment. To be able to have the most housing choices, your household income would need to be between $40,000 and $59,999.

Yesterday, I noted that various community have different mixes of household incomes. With that in mind, I thought it would be interesting to show what percentage of households in each municipality could afford to rent a two bedroom apartment.

White Rock: 48%
Langley City: 52%
Delta: 55%
Langley Township: 58%
Surrey: 65%

Surrey is doing better than other South of Fraser communities when it comes to affordable housing, but as a society, it is a problem that almost half of all households can’t afford to live in a two bedroom apartment.

Monday, June 6, 2016

Linking affordable housing to household income - Part 1

There is a lot of talk about the lack of affordable housing in Metro Vancouver. The Canadian Housing and Mortgage Corporation defines affordable housing as costing less than 30% of before-tax household income. One of the things that hasn’t been explored much in the media is the link between housing costs and household income.

For example, Langley City has the lowest household income in the region outside of Electoral Area A. The median income in 2010 was $31,040. Vancouver had a median income of $41,433. This metric is a coarse; you need to also look at household income bands.

The follow graphs show household income bands in South of Fraser communities, and what the upper limit of housing costs would be for people within those income bands. Housing costs include mortgage payments, strata fees, and property tax, or rent. It does not include transportation costs which also plays a large roll in affordability.

2010 percentage of households in income bands. Select chart to enlarge.

Upper limit of affordable housing costs by income bands. Select chart to enlarge.

As you can see, affordable housing means different things to different groups of people. Affordable housing can and should come in various styles and price points. The affordable housing mix in the Township of Langley should be different than the City of Langley.

Tomorrow, I’ll explore if the current market rental supply is affordable based on household income bands and housing types.

All information is from the March 2016 edition of the Metro Vancouver Housing Data Book.

Tuesday, February 2, 2016

White Rock Water: A Cautionary Tale

While some people may not believe it, Metro Vancouver has a governance model that is looked at throughout the world as the gold-standard of how municipalities can work together.

In our region, municipalities are responsible for the delivery of local service, but work together to tackle challenges that require scale or are regional in nature. If you want to see what level of government is responsible for the delivery of services that you receive, I suggest you check out the Government Service Delivery in Metro Vancouver infographic on this blog.

Because of the geography of our region, and the high-cost of providing clean drinking water, one of the first areas where municipal governments started working together was around water.

As an example, it cost around $800 million to build the Seymour-Capilano Filtration project. No municipal government could afford to do that on their own.

The Metro Vancouver municipalities that don’t receive Metro Vancouver water are Bowen Island Municipality and Lions Bay (for obvious reasons), Tsawwassen First Nation (which is in the process of connecting into the Metro Vancouver water system), and White Rock.

For historical reasons, White Rock never connected to the Metro Vancouver water system. The City relied on well water from Sunnyside Uplands aquifer which was provided by private companies. The most recent company was EPCOR which is owned by the City of Edmonton.

Unfortunately, White Rock’s water supply became contamination in 2010. In the aftermath of the contamination incident, Fraser Health ordered that EPCOR had to chlorinate the system by June 30, 2016.

Beside the contamination incident, the Sunnyside Uplands aquifer also has arsenic and manganese levels that are approaching the limits set out in Health Canada’s Guidelines for Canadian Drinking Water Quality.

Many people in White Rock started questioning the sanity of having a private water system. Recently released documents reveal that White Rock was looking at connecting to the Metro Vancouver Water System as far back as 2013. The estimated cost at the time was $25 million.

Proposed plan to connect White Rock to Metro Vancouver's water system. Select image to enlarge.

The City of White Rock recently bought-out the EPCOR water system for an undisclosed amount of money. Metro Vancouver documents suggest they paid at least $14.3 million for the local water utility.

White Rock’s water supply is now back in public hands. I’m sure the municipality will be connecting into the Metro Vancouver system in the near future because it is the only cost-effective way to provide clean drinking water to its residents.

The saga of White Rock’s water system is a cautionary tale of the cost of a go-it-alone approach to providing municipal services when regional services are available.