Two times per year, the Metro Vancouver Regional Districts hosts a Council of Councils meeting. This meeting provides an opportunity for all municipal and Treaty First Nations elected representatives to receive updates and ask questions about the regional district's services.
On Saturday, I attended a Council of Councils meeting.
One of the significant discussion points was the escalating costs for water and sewer services. Two primary factors are driving these escalating costs. The first primary factor is that the federal government requires all sewage treatment facilities to adhere to a higher quality standard for treated water discharged into our rivers and ocean. This requirement means that the regional district is essentially rebuilding all the sewage treatment plants in our region.
The second primary factor is to accommodate the growth in our population, which requires increasing water and sewage treatment capacity.
The following slide shows the typical household impact due to these cost drivers.

|
| Overall household impact. Select image to enlarge. |
Water, sewage, and solid water fees from the regional district do not directly show up on your property tax bill. Langley City buys water and sewer services from the regional district. The City embeds those costs into the City's water and sewer rates that you pay.
Your waste hauler, which can be the City or be private, pays the solid waste fee.
The regional district is doubling down on its water conservation efforts to reduce the infrastructure needed to accommodate population growth. These efforts include continuing to charge a higher summer water rate.
The regional district is also looking to charge a wet weather rate for sewage. This rate will nudge municipalities to fix their leaky sewer pipes, which allow rainwater to get into them during the winter. This excess water puts unnecessary strain on the sewage treatment system.
Even with this rate increase, Metro Vancouver's water and sewer utilities prices are comparable to other similar-sized regions in Canada.
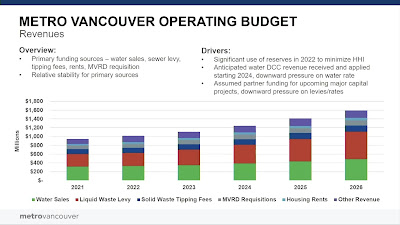
The following chart shows a high-level breakdown of the regional district's operating budget over five years.

|
| Operating budget. Select image to enlarge. |
The following chart shows the capital budget over the same period.

|
| Capital projects budget. Select image to enlarge. |

No comments:
Post a Comment