
One of my favourite websites to explore census data is CensusMapper. With Statistics Canada recently releasing 2021 population and household information, I thought it would be an excellent time to look at how things have changed in Langley City.
|
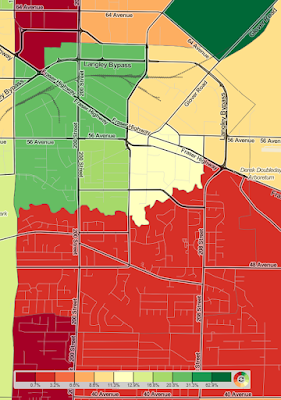
| Change in population for 2016 to 2021. Map from CensusMapper. Data from Statistics Canada. Select map to enlarge. |
Not surprisingly, the population and number of dwellings have grown much faster north of the Nicomekl River than south.
A dwelling can be a detached house, apartment, townhouse, rowhouse, or suite.

|
| Langley City Neighbourhoods. Select image to enlarge. |
The areas west of 200th Street and south of the river actually saw a decrease in dwellings from 872 in 2016 to 860 in 2021. The population increased slightly from 2,451 to 2,472.
The other neighbourhoods south of the Nicomekl River saw a modest increase in dwellings from 2,551 in 2016 to 2,565 in 2021. The population increased from 7,071 to 7,297.
In the Douglas Neighourhood, north of the river and east of 203rd Street, dwelling units increased from 3,977 in 2016 to 4,170 in 2021. The population increased from 7,290 to 8,148.
The Nicomekl Neighourhood saw the most significant increase in dwellings units and population. This neighbourhood is north of the river and west of 203rd Street. The number of dwellings increased from 4,864 in 2016 to 5,676 in 2021. The population increased from 9,076 to 11,046.
No comments:
Post a Comment