Monday, August 22, 2016

Learning from Auckland Transport and vacation alert

I will be taking a break from blogging until after the Labour Day long weekend. I’m in New Zealand at the moment. Auckland is New Zealand’s largest region, and has some of the same challenges that we have in Metro Vancouver. Providing enough affordable housing is top of mind in the region, as is the provisioning of a multi-modal transportation network. Their central government, just like our province, is obsessed with building wide freeways even if it goes against regional sustainable growth objectives.

Me standing by Canada Lane in Auckland. Select image to enlarge.

Over the past weekend, I had the pleasure of having a tour of Auckland and its transportation network with Darren Davis who works for Auckland Transport. AT is like TransLink, but on steroids. Expect for state roads (which are 99.99% freeways), they are responsible for all transportation in the region from sidewalks and roads, to public transit. The agency is arms-length from politicians, but unlike TransLink, has the resources to actually implement a quality transportation network.

Eye and ears at a bus exchange in Auckland is key to providing high-quality customer service and a safe environment. Select image to enlarge.

Over the last few years, Auckland Transport has been working hard to create a multi-modal transportation network. While there is much work to be done —most of Auckland’s land-use doesn’t encourage walking, cycling, or the use of public transit— Metro Vancouver and our provincial government could certainly learn a few things from the operation modal of Auckland Transport.

One of the things that I noticed right away was about the infrastructure in Auckland. It is in an excellent state of repair. Talking with some of the folks at Auckland Transport, I learned that maintaining infrastructure takes priority over expansion. I also learn that taxation levels are set to ensure that infrastructure can be adequately maintained.

High-quality, protecting cycling infrastructure is being rapidly built in Auckland. Select image to enlarge.

When I get back to Metro Vancouver, I will share more observations from Auckland and how it could apply in our region.

Thursday, August 18, 2016

Road blocks to building a sustainable transportation system in Metro Vancouver

Today will be my last post on Metro Vancouver’s annual progress report, “Progress towards Shaping our Future,” for our region’s growth strategy that has been adopted by all but one municipality.

I’ve already posted about creating a compact urban area, supporting a sustainable economy, protecting the environment and responding to climate change impacts, and developing complete communities. Supporting sustainable transportation choices is the last major goal of the regional growth strategy.

TransLink and Metro Vancouver have a shared role when it comes to supporting sustainable transportation choices. While Metro Vancouver guides regional land-use objectives and sustainability goals, TransLink is responsible for developing and implementing a long-term transportation vision.

Legislatively, because the Mayors’ Council must approve any long-term TransLink transportation plan, and because there appears to be a good working relationship between our regional district and TransLink, the regional growth strategy and long-term transportation strategy generally align. You can view TransLink’s long-term transportation strategy and the Mayors’ Council 10-year transportation vision for our region to better understand the nuts and bolts of the transportation strategy for our region.

One of the unfortunate realities in our region is that the provincial government, whether it be the NDP or Liberals, tends to beat by its own drum resulting in massive freeway projects (such as the Massey Tunnel replacement bridge) that don’t align with our regional growth strategy.

One of the major regional growth strategies is to ensure that both land-use plans and our region’s transportation system encourage transit use, cycling, and walking, while discouraging single-occupancy vehicle usage. This also extends to ensuring the flow of goods and services in our region through the lens of sustainability.

The following map shows the 10-year transportation vision for our region.

Map of Mayors' Council 10-year transportation investment plan. Select map to enlarge.

One of the other key metrics is the amount of people that are within walking distance of frequent transit services. As of 2011, 55% of residents in Metro Vancouver were within walking distance of frequent transit. More current information will be available after data from the 2016 census is released.

In next year’s progress report, there will also be updated information on the share of trips people make by transit, driving, cycling, and walking.

The safety of our transportation system is of critical importance. Unfortunately between 2011 and 2013, the rate of injuries and facilities due to collisions increased.

2011/2013 vehicle related collisions, injuries, and fatalities. Select table to enlarge.

How we design our transportation system can have a profound impact on safety. Designing roads that encourage people to drive slower reduce serious injuries and fatalities.

Wednesday, August 17, 2016

How is our region doing with the creation of affordable housing?

Over the last week, I’ve been posting about Metro Vancouver’s annual progress report for our regional growth strategy. Today, I’ll be posting on goal 4 which is to develop complete communities.

Goal 4 is tied closely to goal 1 which is to create a compact urban area. Developing a complete community which includes a variety of housing types, and with access to jobs, shops, services, and recreation activities within a close walk, bike ride, or transit trip; inherently supports the creation of a compact urban area.

Affordable housing is one of the goals of our regional growth strategy. The focus of this goal is to build more row housing and apartments to provide housing at various price points. In 2011, 51% of housing in the region was ground-oriented, 40% was apartments, and 9% was row housing. In 2015, 50% of housing was ground-oriented with 10% now being row housing. 40% remained apartments.

For growing families, row housing likely provides the sweet spot of space, affordability, and support for ensuring accessible communities. Surrey is currently the row house building leader in the region.

Share of growth by housing type between 2011 and 2015 in Metro Vancouver. Select graph to enlarge.

Increasing the social housing and rental housing supply is also a key strategy for our region which is extremely important considering our low rental vacancy rate. Unfortunately, the number of social housing units is on the decline in our region, and the number of purpose-build rental units has been growing at a slow rate.

Change in rental stock between 2011 and 2015 in Metro Vancouver. Select table to enlarge.

Homeless supportive and transitional housing units have increased by 38% which is encouraging. In Langley, these units have increased from 45 in 2011 to 69 in 2016.

Change in the number of homeless supportive and transitional units by sub-region between 2011 and 2016 in Metro Vancouver. Select table to enlarge.

While the region’s goal is to create a healthy mix of housing types, it is really up to municipalities in the region to make it happen. 13 municipalities in the region now have housing action plans including all South of Fraser municipalities.

Tuesday, August 16, 2016

Protecting and preserving the environment. Making progress in Metro Vancouver.

Today, I’ll be continuing with the review of our regional district’s 2015 annual report of the Metro Vancouver Regional Growth Strategy. I posted about creating compact urban areas last week, and supporting a sustainable economy yesterday. The third goal of the growth strategy is to protect the environment and respond to climate change.

One of the primary reasons why we have a regional growth strategy today is because of the rapid urban expansion of our region up until the 1970s. With single-family housing creeping up mountains, and with green space and farmland being paved over, people had enough. If you look at our region today, it’s no surprise that the vast majority of remaining sensitive ecological areas are in parts of the region that were urbanized after the 1970s.

Human health and ecological health are linked, so it is important that we protect our environment. The following map shows sensitive ecosystems in our region. You’ll notice that the City of Vancouver doesn’t have much.

Map of sensitive ecosystems in Metro Vancouver. Select map to enlarge.

There were 167 species in Metro Vancouver listed in the BC Conservation Data Centre as of 2011. In that same year, we had 131,819 hectares of conservation and recreation areas regionally. This grew to 132,671 hectares in 2015 due to changes in regional land-use designations in Coquitlam, Richmond, and Delta.

Changes in the Conservation and Recreation regional land-use designation between 2011 and 2015. Select chart to enlarge.

Over 60% of greenhouse gas emissions come from on-road transportation and buildings. The following maps are from 2010, and show per square kilometre and per resident GHG emissions within the urban containment boundary. This map will be updated in the next few years.

It’s no surprise that White Rock, Langley City, and New Westminster which have better transits service, and a more diverse housing mix have a lower GHG footprint than Delta or the Township of Langley which have poor transit service with a larger portion of their population living in single-family housing.

Maps of per square kilometre and per resident, residential buildings and on-road transportation GHG emissions within the Urban Containment Boundary in 2010. Select maps to enlarge.

District energy systems provide neighbourhood-scale energy distribution that is generally more efficient than heating and cooling buildings individually. Since 2011, our region has seen these systems expand from 4 to 7. Downtown Surrey is the only area in the South of Fraser were a district energy system is being built at the moment.

Monday, August 15, 2016

Metro Vancouver's Regional Growth Strategy. Are we supporting a sustainable economy?

Last week, I posted about Metro Vancouver’s annual performance report for our regional growth strategy. In the first post, I shared some of the key performance measures on how we are doing creating a compact urban area.

The second goal of the regional growth strategy is to support a sustainable economy. This goal is broken down into three strategies: prompting land development patterns that support a diverse regional economy, and employment close to where people live; protecting the supply of industrial land; and, protecting the supply of agricultural land and promoting agricultural viability with an emphasis on food production.

I posted about urban centres and frequent transit areas last week. These places are meant to be focus areas for both housing and office space. In 2011, 67% of office space was located in these centre, with 21% of office space located near rapid transit or the frequent bus network. 12% of office space was not located near high-quality transit service. Unfortunately, the percent total of office space in urban centres or serviced by high-quality transit has decreased.

Change in office space located in centres and near high-quality transit between 2011 and 2015. Select graphic to enlarge.

This year's progress report is missing information on the total number of jobs in each sub-region, as that information will only be available after the current census is completed.

2011 total number of jobs by sub-region. Select map to enlarge.

The region is trying to protect industrial land from conversation to other uses. Industrial land is important to maintaining our role as a gateway port city, and to support manufacturing jobs. Between 2011 and 2015, there was a slight decrease in the total industrial land base.

Changes to the industrial and mixed-employment land-use designations in Metro Vancouver between 2011 and 2015. Select graphic to enlarge.

Protecting agricultural land for food production in our region is critically important. In 2011, 55,314 hectares of land was designated agricultural in our region. Between 2011 and 2015, 71 hectares of land was converted to other uses. The single reason for this loss was due to the Southlands development in Delta.

Changes to the agricultural land-use designation in Metro Vancouver between 2011 and 2015. Select chart to enlarge.

Updated information about the value and amount of land used for food production will be available in future performance reports.

Thursday, August 11, 2016

Massey Bridge will drive additional 20,000 vehicles to Alex Fraser Bridge

Last week, I posted about information I found in the environmental assessment for the proposed George Massey Tunnel replacement bridge. This information showed that traffic through the tunnel has been declining over the last decade, and that with the proposed toll for the new bridge, traffic volume across the new bridge will drop to levels not seen since the 1980s. This brings into question why the currently priced $3.5 billion dollar crossing is even needed.

While traffic levels will plummet at the George Massey Bridge, what I didn’t post about last week was the impact it will have on other crossings.

Two-way Annual Average and Daily Traffic Volumes on river crossings impacted by the Massey Bridge Project. Select table to enlarge. Source: George Massey Tunnel Replacement Project.

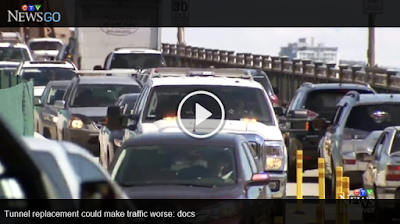
Because a tolled George Massey Bridge will cause a massive drop in traffic, it will also result in a drop in traffic across other bridges along the Highway 99 corridor. The exception being the Alex Fraser Bridge which will have an additional 20,000 vehicle on it due to the George Massey Tunnel replacement bridge.

CTV found out about this information, and did a story on it which you can see by selecting the picture below.

http://bc.ctvnews.ca/congestion-standstill-predicted-if-massey-bridge-built-documents-1.3023978

It’s no surprise that traffic volume will increase across the Alex Fraser Bridge as tolling does eliminates many trips, but some trips will shift over. The same thing happened with the Port Mann Bridge with some people choosing to use the toll-free Pattullo Bridge.

There are two things that are true when it comes to highways in growing regions: you can’t build your way out of congestion, and road pricing/tolling reduces congestion. Instead of building a costly 10-lane mega-bridge, the province and region should agree on a short-term fare tolling policy, and long-term overall road pricing plan that would apply to all major congested corridors in the region.

Road pricing and tolling will reduce congestion, but only if applied equitably. The money recovered could be used to ensure that our current road network is in a state of good repair, to invest in much need transit service, and/or to lower the gas tax.

Wednesday, August 10, 2016

Metro Vancouver's Regional Growth Strategy. How are we doing?

With the exception of the Township of Langley, the remaining 20 municipalities in our region plus Tsawwassen First Nation and UBC have signed onto the Metro Vancouver regional growth strategy. The Township and Metro Vancouver are currently in a non-binding dispute resolution process.

The main goals of the growth strategy are to: create a compact urban area, support a sustainable economy, protect the environment and respond to climate change impacts, and develop complete communities.

Having a regional growth strategy is important, and equally important is to ensure that the strategy is being implemented. The Metro Vancouver regional district recently released its 2015 annual report for our regional growth strategy. How did we do? Today, I wanted to highlight the goal of creating a compact urban area.

Urban Containment Boundary and Regional Land Use Designations (2015). Select map to enlarge.

One of the key components of our current regional growth strategy is to ensure that 98% of all residential and employment growth occurs within the urban growth boundary. This boundary protects rural and agricultural land from sprawl.

Between 2014 and 2015, less than 1% of residential growth occurred outside of the urban growth boundary. This is in line with the regional growth strategy. Between 2011 and 2015, 225 dwelling units were built on rural land. Employment growth information will be available after the 2016 census data is released.

Another important metric is the amount of land available within the urban growth boundary that is undeveloped, but available for development. In 2015, there was 7,500 hectares of land within the urban growth boundary available. Of course, there is much more land available when you consider the opportunity for redevelopment.

Status of the General Urban Regional Land Use Designation (2015). Select map to enlarge.

Another key goal is to encourage growth in urban centres and along frequent transit corridors which helps support active transportation and public transit usage.

In 2011, 19% of the population lived in urban centres. This number grew to 20% in 2015. The regional growth strategy target is to have 40% of all dwelling unit growth occur within urban centres. In 2015, 42% of dwelling unit growth occurred within urban centres.

Urban Centre and Frequent Transit Areas (2015). Select map to enlarge.

Over the next little while, I’ll be highlighting some of the other measures that are being tracked to see if our region is meeting the goals of its growth strategy.

Tuesday, August 9, 2016

City of Langley Community Survey Results: 43% of women do not feel safe in Downtown Langley during the evening. What can we do about it?

The City of Langley commissions a community survey every three years to better understand how residents feel about their community, and the services they received from the municipality. Last week, I posted about quality of life in the City. Yesterday, I posted about the value people received for the taxes they pay to the City. Today will be my last post about the community survey, and will focus on Downtown Langley.

Perception of Downtown Langley Safety. Select graphic to enlarge.

During the day, people feel safe when they are in Downtown Langley. This makes sense as there are plenty of shops open, and many restaurants and coffee shops who's customers provides “eye and ears” on the street which discourages negative activity. On top of that Downtown merchants, the City of Langley, and various community groups host many events in Downtown during the day. This creates a positive atmosphere which brings even more people into the Downtown.

During the evening is a different story. 72% of men and 43% of women feel safe in Downtown Langley during the evening. If 43% of women don’t feel safe that means there is a problem.

One of the challenges is that many of the restaurants and coffee shops close early in the evening, removing “eye and ears” from the street. Because there is a limited amount of apartments above shops, the possibility to keep “eye and ears” on the street is further reduced.

Even the built-form of some of the areas in the Downtown create the perception of an unsafe environment. Empty parking lots become places where negative activity occurs in some parts of our Downtown.

So how can we improve the perception of safety in Downtown Langley? A critical step is to bring positive activity into the Downtown core during the evening. This is one of the reasons why I support an arts centre in Downtown as it will draw people into the core during the evening. In partnership with Downtown merchants, we should also think about hosting events in the evening such as a night market. Encouraging mixed-use buildings with apartments above shops will help provide “eye and ears” on the street. These things will also help create a critical mass which will encourage restaurants and coffee shops to stay open longer.

Another thing that we need to change is our built-form. Surface parking lots create dead spaces, and should be discouraged in our Downtown. Underground parking, or a common parkade to remove the requirement of surface parking, needs to be considered.

The City of Langley and Downtown merchants have done a great job of bringing positive activity to our core during the day, we now need to do the same during the evening.

Monday, August 8, 2016

City of Langley Community Survey Results: Maintaining and enhancing services important for residents

Many local governments were formed because of the desire to deliver services that met the needs of residents in a specific geographic area. For example, the City of Langley was created to deliver urban services such as street lights.

In fact, BC has a long history of municipalities, regional districts, and improvement districts that provide a variety of local services that are responsive to the needs of the people that they serve. It should come a no surprise that people generally have a strong degree of support for the services that local governments provide.

As I posted about last week, the City of Langley released the results of its most recent Community Survey. One section of the survey looks at the value people get for the taxes they pay to the City of Langley, and how they feel about the services the City provides in return.

Over the past decade, the amount of people that say they get good value for the taxes they pay to the City has increased to 86%.

Langley City residents' perception of the value they receive for the taxes they pay to the City. Select chart to enlarge.

There are some people that run for local office because they want to “end the gravy train.” I can tell you that the City of Langley is a lean operation with no gravy to be found. When it comes to taxes, the vast majority of residents in the City of Langley want to maintain or enhance the services that the City provides, even if that means increasing taxes.

City of Langley residents' support for increasing or cutting taxes, and the relationship to local government services. Select chart to enlarge.

The City of Langley has a large amount of infrastructure (water, sewer, roads) that was installed in 1970s. Must of that infrastructure is coming to the end of its useful life. To maintain our current investment programs while also renewing this aging infrastructure would be impossible. Council wanted to know how people felt about an Infrastructure Levy to renew aging water and sewer lines, and roads. The majority of people support this idea.

City of Langley residents' support for infrastructure renewal financing approaches. Select chart to enlarge.

People support local governments and the services they provide because they can see the results on-the-ground of how their money in used, and the higher level of accountability and responsiveness to their needs.

Thursday, August 4, 2016

City of Langley Community Survey Results: Quality of Life and City Services

Every three year, the City of Langley commissions a community survey as a way to take a pulse of what people that call Langley home feel about their community. The survey is weighted to match the demographics of Langley, but it does rely on interviewing people with landline phones exclusively. This means that some demographics may not be fully represented in the survey.

Nonetheless, the survey’s results provide valuable insight into what people think about Langley City. Over the next little while, I’ll be sharing some of the results of the survey.

Overall, people are satisfied with their quality of life in Langley City though around 28% said that their quality of life has worsened over the last three years. People's views that quality of life has worsened in Langley City has been trending down over the last decade.

Overall quality of life of residents in the City of Langley. Select chart to enlarge.

Changes in the quality of life over the past three year. Select chart to enlarge.

The follow charts shows why people think that quality of life has improved, and why quality of life has worsened.

Reasons why quality of life has improved. Select chart to enlarge.

Reasons why quality of life has worsened. Select chart to enlarge.

One of the promises I made during the election campaign was to work towards improving our parks and streets including keeping them in a state of good repair and enhancing safety. I also stated that we need to move forward with our action plan to reduce homelessness. While these things won’t happen overnight, they must be addressed.

People have been consistently satisfied with the services that the City of Langley provides. The one exception is road conditions which has tracked down 9% over the last 12 years.

Satisfaction with City of Langley services over the last 12 years. Select chart to enlarge.

As a community we will need to invest more to ensure that our core infrastructure remains in a state of good repair, while improving active transportation infrastructure and implementing traffic calming. Next week, I’ll post more about the results of the community survey.

Wednesday, August 3, 2016

Province’s own numbers show Massey Bridge unneeded

”Because congestion” is a reason that the provincial government loves using when it needs a justification to build massive bridges and large roads in Metro Vancouver. Tolls are used to offset some of the costs of building these projects. Tolls also bust congestion.

As can be seen on the Port Mann Bridge, there is less traffic on the bridge today than went across the old bridge in the past. There has only been a jump in traffic over the Port Mann this May and June likely due to the Pattullo Bridge being virtually closed due to rehabilitation.

The environmental assessment for the proposed George Massey Tunnel replacement bridge is currently in progress. 145 pages of the material submitted by the province for the environmental assessment deals with traffic.

Here’s some facts:

Average traffic volumes across the George Massey Tunnel and Alex Fraser Bridge since 2005. Select table to enlarge.

Traffic volume through the Massey Tunnel has been declining over the last decade. There was less traffic going through the Massey Tunnel in 2014 on average than in 2003.

The Ministry of Transportation’s “independent” traffic model shows that a tolled crossing would drop traffic to a level not seen since the 1980s. TransLink numbers show an even stepper decline in traffic.

Traffic forecasts. TransLink's tolled traffic forecast: TL-RTM Tolled. Independent traffic forecast: SDG Independent. Select chart to enlarge.

The Alex Fraser Bridge has seen an increase in traffic. If the provincial government was serious about reducing congestion, it would toll all river crossings to reduce congestion, using the revenue to invent in keeping the current road network in a state of good repair, and investing the remainder into transit and the regional transportation vision.

If the province invested the money it spent on the Port Mann Bridge and soon-to-be George Massey Bridge instead on the regional transportation vision, we would have world-leading bus service and rail rapid transit along Broadway, King George, 104th Avenue, and Fraser Highway to Langley today.

Tuesday, August 2, 2016

What is an ACT team, and how can they reduce homelessness in Langley?

People end up experiencing homelessness for a variety of reasons. Some of those reasons are because of mental illness, addition, abuse, or a combination of the three.

For people that have stable housing and a support system in place, accessing mental health services can be a challenge. For people in unstable situations, it can be next to impossible.

The number of people experiencing homelessness is growing in Langley (as well as in the rest of Metro Vancouver.) It would be unreasonable to expect someone who is experiencing homelessness combined mental illness to reach out for help. We have to come to them.

One of the innovative programs to get people help is Assertive Community Treatment, or ACT. The following video explains what it is all about.

You can also find more information on the ACT BC website. Some of the services that an ACT team provides include:

  • Finding housing
  • Accessing medical care
  • Substance use counselling and/or access to treatment
  • Life skills support/skill building
  • Medication administration
  • Grocery shopping with staff
  • Social and recreational events
  • Employment opportunities
  • Connecting clients to community resources
  • Transport clients to appointments
  • Supporting and encouraging: healthy lifestyle choices, personal hygiene, short and long-term goal setting and money management
  • Connecting to income assistance service

Currently there are ACT teams in Surrey and Abbotsford, but there is no team in Langley. Given the increase in people experiencing homelessness in Langley, it may be time for the provincial government to fund an ACT team in Langley.

While not everyone camping in parks or sleeping on the streets has a mental illness, getting people with mental illness the help they need is a critical step to reducing the number of people experiencing homelessness in our community.