Monday, August 11, 2014

The SkyTrain is not the crime train

One of the things that I sometime hear is that rail-based transit brings crime to an area. In fact, many people believe that SkyTrain increases crime and brings “undesirable” people to an area. The association between crime and SkyTrain came from a Master’s Thesis by Jennifer Buckley in 1996 called “Public Transit and Crime: A Routine Activities/Ecological Approach.” Buckley found that 49% of Vancouver Police Department call-outs were within 750m of a SkyTrain station. To some people, this seemed like a smoking gun linking increased criminal activity to the SkyTrain system. While the media certainly had a heyday with the report back in the day, the full story was never told. SkyTrain runs through some of the highest-density areas in our region; it should come as no surprise that where there is more people, there is more crime in general.

Other studies since the mid-90s have come out that show that there is no link between rail-based public transit and crime in North America. While these studies provided good information, there was no study in Metro Vancouver that looked at crime in areas before and after the introduction of SkyTrain. That was until earlier this year.

I found a TransLink commissioned report called “The Changing Morphology of Crime in Communities Serviced by Skytrain” by Linh Riddick. The report was commissioned to see if the introduction of the Canada Line caused an increase in crime in the surrounding Canada Line station areas, and to lay the groundwork to study crime before and after the introduction of the Evergreen Line which is slated to open in 2016.

As they say, a picture is worth a thousand words.

Lower Mainland Crimes Against the Person, 2008 - 2012. Select image to enlarge.

Riddick found that crimes against people such as robberies and assaults are down throughout the region and that "although some have made the argument that the introduction of new Skytrain stations has caused increases in crime, a comparison of the maps... would contradict this theory."

Lower Mainland Property Crime, 2008 - 2012. Select image to enlarge.

On property crime, Riddick found that:

Although the Canada Line opened in August 2009, the analysis of crime data indicates that the hotspots of violent crime in the areas surrounding these light-rail stations pre-existed the introduction of new line. Similarly, the Coquitlam Centre area which will be the future terminus of the Evergreen Line has also been an area of concentration for property crime in the region for several years.

It would seem that SkyTrain does not cause an increase in crime in an area. I would suggest that it actually causes an area to get better. Just look at all the positive change happening around the SkyTrain stations in Surrey.
Thursday, August 7, 2014

Walking Tour near Fort Langley

When near or around Fort Langley, you'll normally learn about the colonial history of the area. If you'd like to explore the full history of the area, the Seyem’ Qwantlen Business Group is hosting walking tours throughout August.

Join tour guides from the Kwantlen First Nation for a relaxing walk over the Bedford Channel and onto McMillan Island to learn about:
-The rich history of the Kwantlen People
-Traditional Knowledge and stories
-Environmental Stewardship Initiatives led by Seyem’ Qwantlen Business Group

When: 7pm-8pm every Thursday evening of August 2014
August 7th, August 14th, August 21st, August 28th
Where: Meet tour guides outside the front doors of lelәm’ Arts and Cultural Café
Route: From lelәm’ Arts and Cultural Café to Sqwalets Channel on Glover Road (total walk is 1km)
Cost: Free
Please Bring: Good walking shoes

This walking tour is funded by Port Metro Vancouver and the Seyem’ Qwantlen Business Group.

Wednesday, August 6, 2014

Introducing B-Line and express bus service, ridership soars; Trolley bus ridership down.

Yesterday, I posted about TransLink’s first quarter results. One of the things I noted was that generally ridership was up in the South of Fraser and down in Vancouver. I was curious to see if there were any patterns that might provide some insight into these changes in ridership. I look at TransLink's latest Bus Service Performance Review.

The first major pattern I noticed was that people seem to value express bus service. For example, in Surrey the 320, 321, and 394 provided frequent bus service along the King George Boulevard/104th Avenue Corridor. In 2012, these routes had a combined annual boarding of 6,221,000. With the introduction of the 96 B-Line, which is an express bus service that covers this corridor, ridership did drop on some of the local routes, but overall annual boarding along that corridor was 8,224,000. This is a 25% increase!

In Langley, with the introduction of the 555 express bus route that goes between Carvolth Park & Ride and SkyTrain, overall annual boarding on routes between Walnut Grove and SkyTrain increase by 30% of the last few year.

In Vancouver, I noticed that annual ridership continues to climb on the 99 B-Line, which serves the Broadway corridor to UBC, even while ridership on some routes that serve UBC slightly declined.

One of the big things I noticed about Vancouver was that bus routes that terminate or go through Downtown had the largest drops in ridership. In fact, ridership seems to be dropping on all the electric trolley routes more that diesel bus routes. While many bus routes go through Downtown Vancouver, I wonder if there is a connection there. It certainly warrants further investigation.

One of the key take-aways seems to be that people prefer express bus service, even if it means walking a bit further to a bus stop.

Tuesday, August 5, 2014

TransLink First Quarter Results

With all the excitement around SkyTrain over the last few weeks, you might have missed that TransLink released their first quarter results on Friday, July 25th.

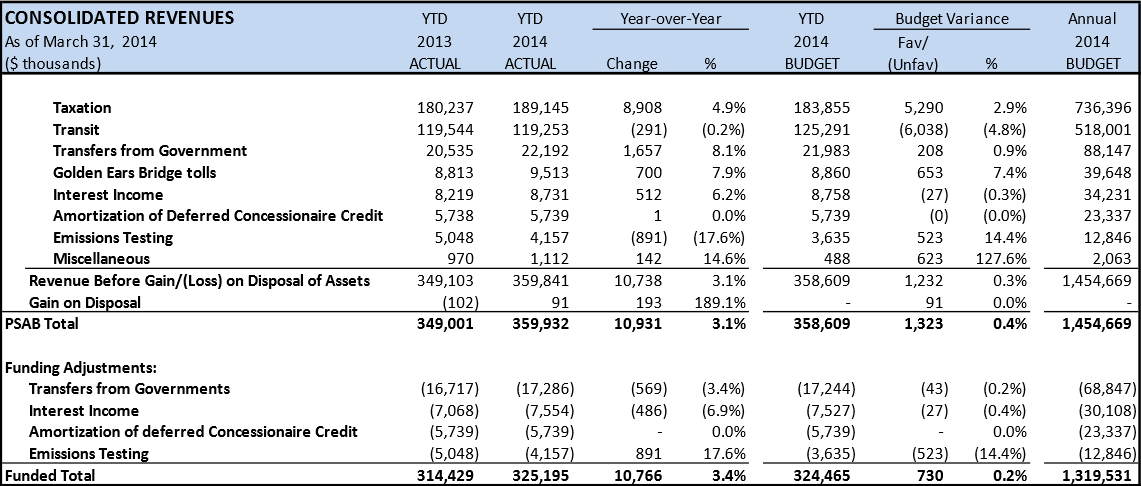
On a good note, TransLink had a $15.9 million surplus in the first quarter. TransLink had budgeted for a slight deficit in the first quarter. According to TransLink, the surplus was mainly due to when it will contribute money to municipal governments in Metro Vancouver to support the Major Road Network.

TransLink revenue, compares Q1 2014 to Q1 2013. Select table to enlarge.

The majority of TransLink revenue comes from taxation. TransLink budgeted for an increase in the revenue it receives from fuel tax and parking tax, and a reduction in revenue it receives from property tax (due the Mayors’ Council decision to remove a time-limited property tax to pay for transit expansion.)

TransLink received $4.9 million more then it budgeted from fuel tax. According to TransLink “the increase is largely attributable to higher commercial diesel sales.” TransLink also noted that the lower value of the Canadian dollar is likely reducing the amount of cross-border fuel purchasing.

TransLink also received $467,000 more than budgeted from the parking tax. This tax is applied when paying for parking in a private lots. Apparently the increase was likely due to some parking vendors pocketing extra cash by not lower their “all inclusive” parking rate when the province switched from HST back to PST.

The second largest source of revenue for TransLink is from fares. Fare revenue in the first quarter of 2014 was short by $6 million. TransLink attributes this to the 2.9% decrease in ridership in the first quarter of 2014 compared to the same period in 2013.

TransLink expenses by segment, compares Q1 2014 to Q1 2013. Select table to enlarge.

As part of its quarterly report, TransLink also makes available various non-financial performance indicators.

In the first quarter of 2014, TransLink bus service hours slightly increased, but the amount of kilometres buses travel decreased. In the first quarter of 2013, there were 58.8 million boardings. In the first quarter of 2014, there were 55.8 million boardings, a reduction of about 5%.

Rail transit services hours and kilometres travel decreased in the first quarter of 2014, compared to the first quarter of 2013. There was 28.8 million boardings on SkyTrain and West Coast Express in the first quarter of 2013, and 28.3 million boarding on rail transit in the first quarter of 2014. This is a reduction of about 1%.

Service optimization likely played a role in reduced transit ridership in places like Coquitlam, but I have wonder if overcrowding in Vancouver is discouraging people from taking transit.

As I posted about previous, while transit ridership continues to grow in the South of Fraser, ridership is shrinking in the City of Vancouver where the largest share of bus ridership resides. Besides overcrowding, could Vancouver’s investment in walking and cycling infrastructure be encouraging less people to take transit?

On a different note, TransLink currently has $1.1 billion in active capital improvement projects on the go.

Major project construction that will be starting shortly include:
-Metrotown SkyTrain Station and Bus Exchange Upgrade: $35 million
-Commercial-Broadway SkyTrain Station Expansion: $32 million
-New Westminster SkyTrain Station Upgrade: $9 million.

For more information on TransLink financial and performance data, check out the full first quarter 2014 report.