
TransLink recently released their 2012 Year-End Financial and Performance Report. As a follow-up to yesterday’s post about ridership, I thought it would be interesting to do some graphs on transit expenses and ridership. Though it is not surprising, increasing transit spending also increases transit ridership.
| Graph of transit expenses and ridership. Click image to enlarge. |
The interesting thing though is that there is not a linear correlation between ridership growth and spending on transit. Though I don’t have too much data to go off of, it looks like you need to increase spending on transit by 1.5% for every 1% increase in ridership.
| Graph of percentage increase in transit expense and ridership. Click image to enlarge |
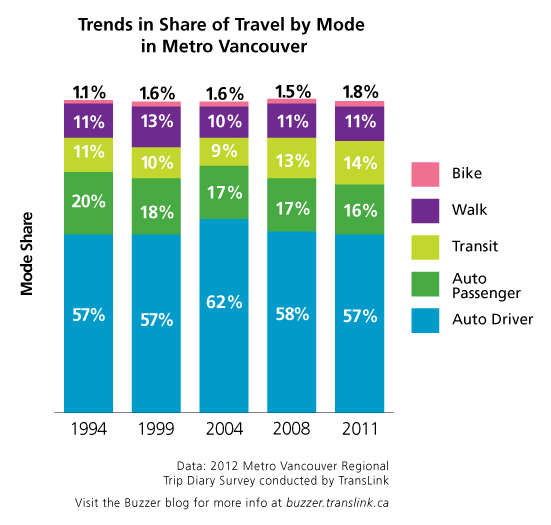
On the topic of ridership, I should point out that ridership is based on unlinked trips. So for example, my daily commute of using the 502, SkyTrain, and 84 could be counted as 6 trips a day. While it is great to see ridership increase, another statistic that matters is the increase in transit mode share (or the percentage of total trips in the region that use transit.) Mode share information is only calculated every four year in Metro Vancouver, but the good news is that transit mode share is increasing as well.
No comments:
Post a Comment