Thursday, October 31, 2019

Changes in commuting over the last 20 years in Metro Vancouver. Neighbourhoods that generate congestion, neighbourhoods that don't.

Jens von Bergmann runs the Mountain Doodles blog where he shares data visualizations and insights based on Statistics Canada data. I’ve previous shared some of the visualizations that he has created in the past. His latest visualizations look at how people commute to work in Metro Vancouver based on neighbourhood-level census data.

One of the interesting visualizations is the change in the number of people driving to work between 1996 and 2016 which is the most recent census.

Change in number of drivers 1996 – 2016. Select image to enlarge. Source: MountainMath, Statistics Canada

The purple areas show where there has been a larger increase in the number of people driving to work, while the yellow areas show where there has been a decrease in the number of people driving to work.

In Langley City, we can see that in some neighbourhoods there has been no or a reduction in people driving to work in absolute numbers. In other Langley City neighbourhoods, there has been modest growth such as in the 198 Street/Brydon area over the last 20+ years.

Clayton in Surrey, and Willoughby in the Township of Langley, have seen a large increase in people driving to work over the same time period. This makes sense as these are new communities.

Another interesting map shows the net difference between driving and non-driving as the method of commuting to work over the last 20+ years.

Difference in change in number of non-drivers vs drivers 1996 – 2016. Select image to enlarge. Source: MountainMath, Statistics Canada

This is useful as it can show which neighbourhoods are more auto-dependent, even accounting for population growth and changes in the number of people that must commute to work.

Again, Langley City has neighbourhoods that range from transit-friendly to more auto-dependent. The most auto-dependent neighbourhoods near Langley City are Clayton and Willoughby.

There are two reasons for neighbourhoods being more auto dependent. One is a lack of transit service, and the other is urban design that doesn’t encourage walking. Most transit riders start their commute by walking.

The next census will be in 2021, so it will be interesting to see how things have changed. There is much more information Jens’ Commuter Growth post.

Wednesday, October 30, 2019

Tips to make sure your vehicle is not a target for “prolific offenders”

I currently chair Langley City’s Crime Prevention Task Group. One of the major goals of the task group is to provide education to both residents and business owners in our community about how they can help reduce the types of crime we see in our community. While Langley City is a safe community, we have a large amount of people stealing items from vehicles, and stealing vehicles. The people committing these crimes are a small number of what the RCMP calls “prolific offenders.”

While the RCMP works to catch these “prolific offenders”, they also provided our task group with a winter safety sense guide to share with others. This guide provides tips on how to help reduce these kinds of crime.

Below is some excerpts from the guide.

When parking your vehicle:

  • Never leave a wallet or purse in your vehicle
  • Look around your vehicle and see what items you’ve left in plain sight. Things that don’t appear temping to you, could be attractive to a thief. Items can include clothing, food, and loose change.
  • Report any suspicious activity around vehicles to the RCMP
  • Chose well-lit areas to park your vehicle. Park if possible in areas near high foot traffic.
  • Always close windows and lock doors
  • Use an anti-theft device
  • Keep your spare keys in your wallet, not in your car

When shopping:

  • See if a shop or mall has lockers to store purchases until you are finished shopping
  • Do not lock your purchases in your vehicle or in your vehicle’s trunk. Thieves often target parking lots watching for people to place items in their vehicle, and then leave their vehicle unattended.

At home:

  • Light your driveway all night
  • After opening your garage door or strata parking gate, watch out for thieves waiting to slip inside. Wait for the door or gate to close behind you.
  • If you see any suspicious activity around your parking area, call the RCMP

The Non-Emergency Line for the Langley RCMP is 604-532-3200.

Tuesday, October 29, 2019

Slicing and Dicing the Numbers: 2019 Municipal Property Tax in Metro Vancouver

The provincial government collects taxation information from municipalities, and provides this information online. They have recently posted this information for 2019 online. To help visualize this information, and provide some context, I’ve created some tables and charts.

The first chart looks at the per capita property tax in 2019. I used the information from the province’s Schedule 703, and combined that with 2018 population estimates. I’ve highlight Langley City for convenience.

2019 Property Tax Per Capita in Metro Vancouver by Municipality. Select chart to enlarge.

One of the things that stands out is that Surrey has a significantly lower per capita property tax. One of the things to consider is household size. For example, Surrey has an average household size of 3 while Langley City has an average household size of 2.1.

Municipality Population Total Property Tax Collected Per Capita Property Tax
Surrey 569,065 $364,429,422.12 $640.40
Anmore 2,389 $2,210,793.40 $925.41
Maple Ridge 88,626 $84,644,022.90 $955.07
Coquitlam 149,490 $151,087,559.85 $1,010.69
Langley City 27,577 $29,069,351.98 $1,054.12
Port Coquitlam 62,844 $66,549,258.31 $1,058.96
Richmond 216,300 $231,099,685.35 $1,068.42
Belcarra 684 $734,048.79 $1,073.17
White Rock 21,370 $23,163,637.99 $1,083.93
Langley Township 127,290 $138,325,635.12 $1,086.70
New Westminster 76,799 $83,939,035.07 $1,092.97
Burnaby 248,476 $273,684,820.07 $1,101.45
Pitt Meadows 19,772 $22,689,385.92 $1,147.55
District of North Vancouver 90,814 $104,615,821.97 $1,151.98
City of North Vancouver 56,741 $65,831,476.42 $1,160.21
Lions Bay 1,407 $1,634,595.33 $1,161.76
Vancouver 672,963 $823,944,278.13 $1,224.35
Port Moody 35,613 $45,406,517.80 $1,275.00
Delta 109,484 $144,196,476.30 $1,317.06
Bowen Island 3,977 $5,379,364.22 $1,352.62
West Vancouver 44,886 $73,837,205.17 $1,644.99

Another way to look at property tax is by a representative household. This is known as the province’s Schedule 704.

Property Tax on a Representative House in Metro Vancouver by Municipality. Select chart to enlarge.

Again, Langley City has been highlighted for convenience.

Municipality Property Tax on a Representative House
Belcarra $1,673
Surrey $2,028
Langley City $2,081
Pitt Meadows $2,110
Langley Township $2,126
Port Coquitlam $2,339
Burnaby $2,409
Maple Ridge $2,417
Bowen Island $2,426
Delta $2,449
Coquitlam $2,580
Richmond $2,592
City of North Vancouver $2,742
Anmore $2,838
Distrcit of North Vancouver $2,915
Lions Bay $2,923
New Westminster $2,949
Vancouver $3,059
Port Moody $3,346
White Rock $3,479
West Vancouver $4,802

Property tax bills also have charges that are set by the province, Metro Vancouver Regional District, and TransLink. There are also user fees for water, sewer, and solid waste. The proceeding tables only look at property tax set by municipalities.

Monday, October 28, 2019

Fall Regional Council of Councils: Water, Sewer, Parks, and Affordable Housing Updates

Two times per year, the Metro Vancouver Regional District hosts a Council of Councils meeting. This meeting is an opportunity for all 156 elected local government representatives in Metro Vancouver to receive updates from and ask questions directly to the regional district. Municipalities in our region appoint people to sit on the Metro Vancouver Board which is where regional decisions are made. Currently, there are 40 people on the Metro Vancouver Board.

On Saturday morning, all members of Langley City council attended the Council of Councils meeting.

Some of the topics covered are summarized below.

Strategic Plan

The regional district has updated its strategic plan based on a 30-year financial outlook. This plan guides the actions of the regional district. The plan focuses on strengthening the regional federation of local governments, continuing to delivery core services (water, sewer, solid waste, affordable housing, and parks), and improving regional planning.

35,000 people moving to our region every year, plus the impacts of climate change, mean that serious investment is needed to ensure that clean drinking water is available for everyone, wastewater is properly treated, and that our natural environment continues to thrive.

More Information: http://www.metrovancouver.org/about/strategic-directions/Pages/default.aspx

5-Year Budget Outlook

Metro Vancouver Regional District services are funded directly by property tax except for water and sewer services. Water and sewer services are purchased by member municipalities who are charged a rate based on consumption. In Langley City, we use water meters to pass this charge onto property owners based on individual consumption. The City also adds the cost to maintain the local distribution system which connects individual properties to the Metro Vancouver water main. This is charged based on a flat fee plus consumption.

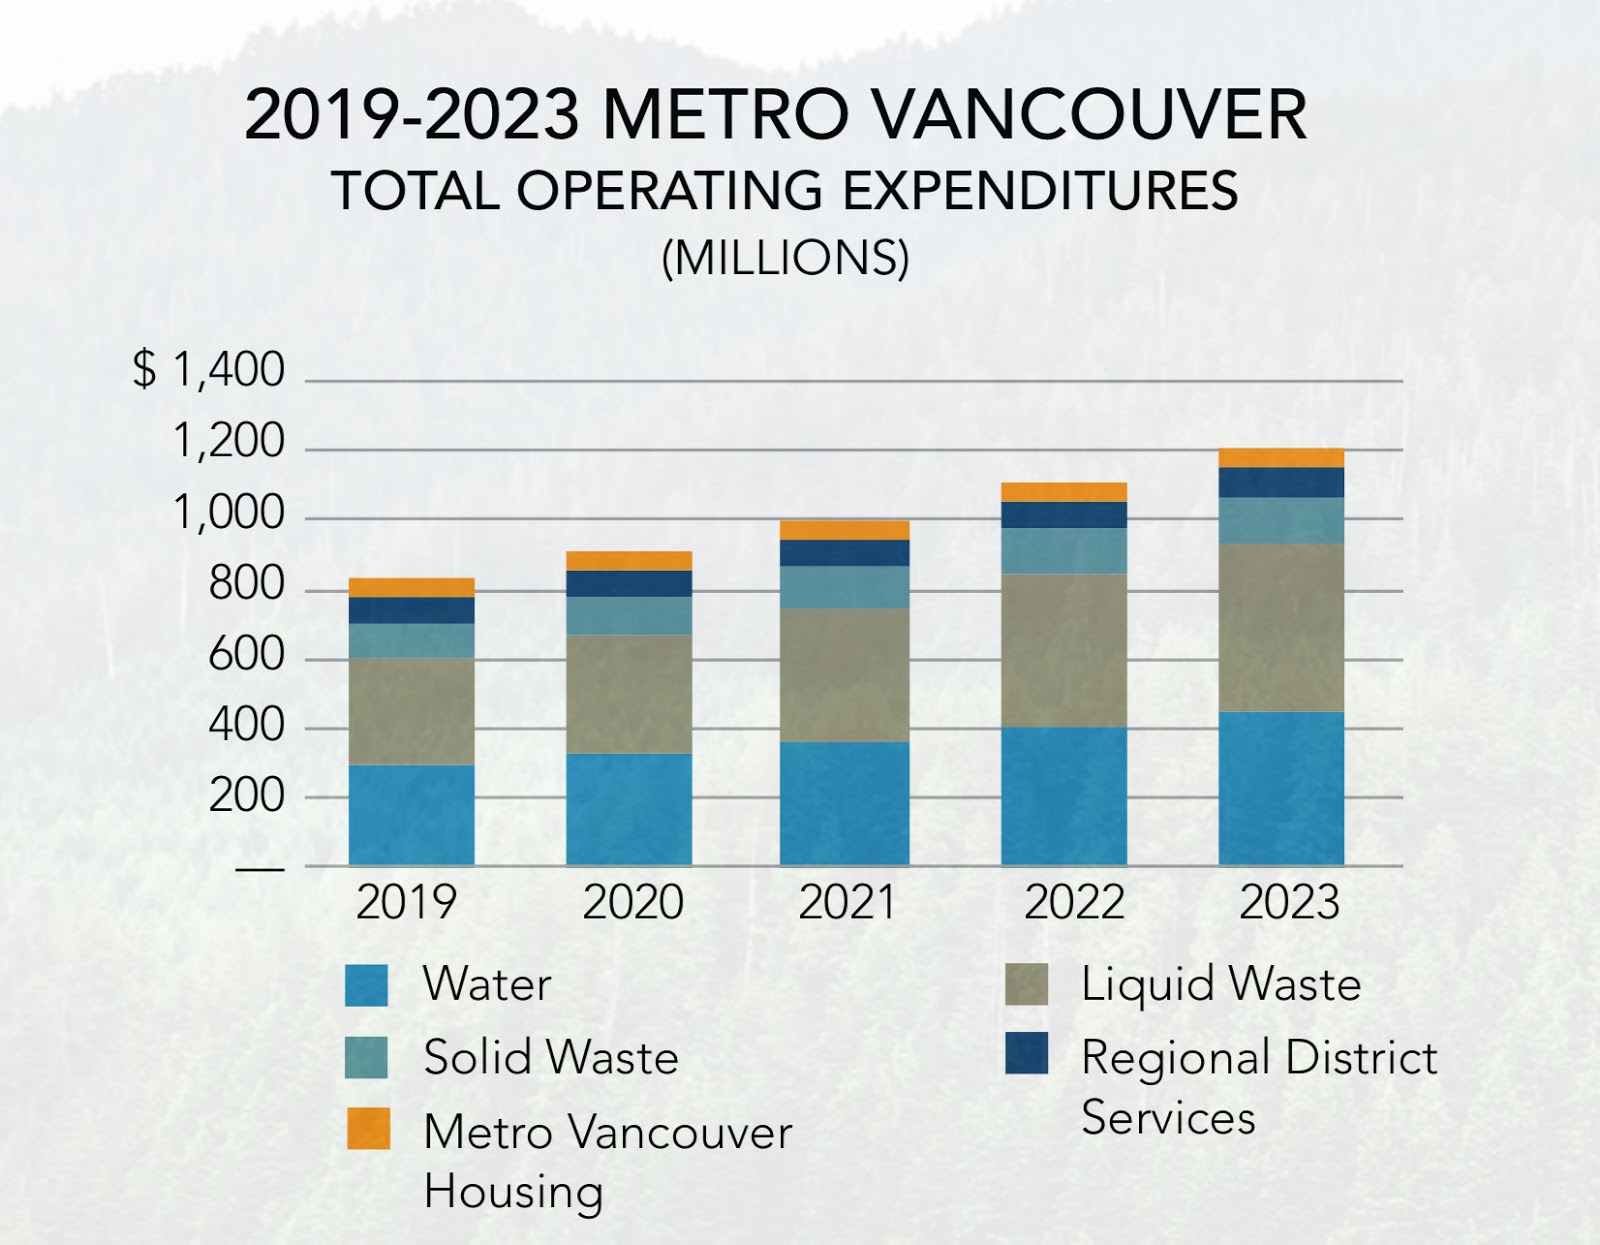
5-year outlook, regional operation expenditures. Select chart to enlarge.

5-year outlook, regional capital expenditures. Select chart to enlarge.

Regional water and sewer services are by far the largest regional expenditures. These costs will be increasing over the next 5 years due to the massive investment needed to adapt to the impacts of climate change, keep the system in a state of good repair, and to accommodate population growth.

One of the big projects in Langley is the $537.6 million expansion of the Northwest Langley Wastewater Treatment Plant.

More Information: http://www.metrovancouver.org/services/financial-services/programs-budget/BudgetPublications/MV2019-2023-5-YearOutlook.pdf

Regional Parks

Parkland acquisition is a priority as we need to protect the remaining green space that is currently undeveloped in our region. The 2020 regional budget proposes $7.6 million per year going forward to make this happen. The goal is to protect an additional 10% of the land in our region.

40% of the land in our region is protected from development. 10% of the land is unprotected and undeveloped. Select chart to view.

More information: http://www.metrovancouver.org/services/parks/ParksPublications/RegionalParksLandAcquisition2050.pdf

Metro Vancouver Housing

The regional district is the second largest affordable housing provider after BC Housing in Metro Vancouver. 9,400 tenants living in Metro Vancouver Regional District Housing. There is an affordable housing crisis in our region.

To help respond to this crisis, the regional district is upping its housing budget by $4 million per year to build at least 500 new units of affordable housing. We were told at the meeting that this number could grow to 1,500 new units with partnerships likely to come from the feds and province.

Air Quality and Climate Change

Metro Vancouver is responsible for regulating air quality from stationary emitters such as factories, plus off-road vehicle emissions such as construction equipment. The regional district also provides statistics and advice to municipalities to reduce emissions and mitigate the impacts of climate change.

More information: http://www.metrovancouver.org/climate2050